

Fired to Entrepreneur
The Layoff-to-Entrepreneur Pipeline in Maryland's Small Business Ecosystem


Abstract
This paper examines whether major employer layoffs catalyze small business formation in Maryland, and whether the characteristics of displaced workers predict entrepreneurial transition. Using a staggered difference-in-differences framework applied to six geographic zones across 2015–2022, combined with a worker-level probit analysis of 7,370 displaced individuals drawn from WARN Act filings matched to Revelio labor market data, we document two primary findings. First, qualifying layoff events (≥100 workers) are associated with a positive but statistically imprecise increase in new establishment entry rates, with an event-study estimate of +4.97 per 1,000 establishments at one year post-displacement (p=0.090). Second, and more robustly, pre-displacement seniority is the primary determinant of entrepreneurial transition among displaced workers, with senior workers (levels 5+) transitioning to entrepreneurship at 3.4 times the rate of junior workers (0.842% vs. 0.245%), a finding that holds across five model specifications. These results suggest that the layoff-to-entrepreneurship channel operates primarily through accumulated human capital rather than financial capital accumulation, with implications for workforce development and small business support policy in Maryland and comparable mid-Atlantic labor markets.
1. Introduction
1.1 Motivation and Research Question
Economic disruption from large employer layoffs has ambiguous aggregate effects on small business ecosystems. Two competing mechanisms operate in opposing directions: demand destruction, whereby displaced workers lose income and local spending contracts, and entrepreneurial release, whereby the same displacement event frees workers to launch new businesses. This paper addresses the net effect of these mechanisms in the Maryland labor market.
The primary research question is: When large Maryland employers announce qualifying WARN Act layoffs, do displaced workers become small business founders, and does this vary by worker earnings tier, industry sector, and county geography? A secondary question asks: What worker-level characteristics predict the probability of entrepreneurial transition post-displacement?
Maryland represents an especially relevant laboratory for this analysis. The state hosts a dense corridor of federal defense and intelligence contractors concentrated in the DC suburbs and Anne Arundel County, alongside a diverse economic geography ranging from Baltimore City’s urban core to the rural Eastern Shore and Western Maryland. This heterogeneity allows for meaningful within-state comparison across displacement events and labor market environments.
1.2 Contribution to Literature
This study represents the first matched analysis of WARN Act layoff events and individual career trajectory data at the Maryland zone level. Drawing on Revelio Labs’ longitudinal employment records accessed through the Wharton Research Data Services (WRDS) platform, we track displaced workers’ career trajectories with a level of individual-level precision not available in prior state-level studies. Prior work conflates earnings and seniority as mechanisms for post-displacement entrepreneurship; this paper disentangles them by demonstrating that earnings loses statistical significance once seniority is controlled, identifying accumulated human capital as the binding constraint rather than financial capital availability.
The analysis extends Audretsch (1995) and Haltiwanger et al. (2013) small business dynamics frameworks to the displacement context and provides actionable county-level evidence for Maryland economic development policy. The six-zone geographic framework follows the prior CBC Research classification used in DeBaugh (2024), enabling direct comparison with earlier findings on commercial activity responses to exogenous economic shocks in Maryland.
1.3 Preview of Results
At the zone level, we document a directionally positive average treatment effect of qualifying WARN Act layoffs on new establishment entry rates: the Callaway-Sant’Anna (2021) CS DiD estimator produces an overall ATT of +2.271 per 1,000 establishments (SE=1.654, p=0.171), and the event-study estimate peaks at +4.97 at one year post-treatment (p=0.090). These estimates are statistically imprecise, reflecting the fundamental constraint imposed by a six-zone panel in which five of six zones received treatment by 2015.
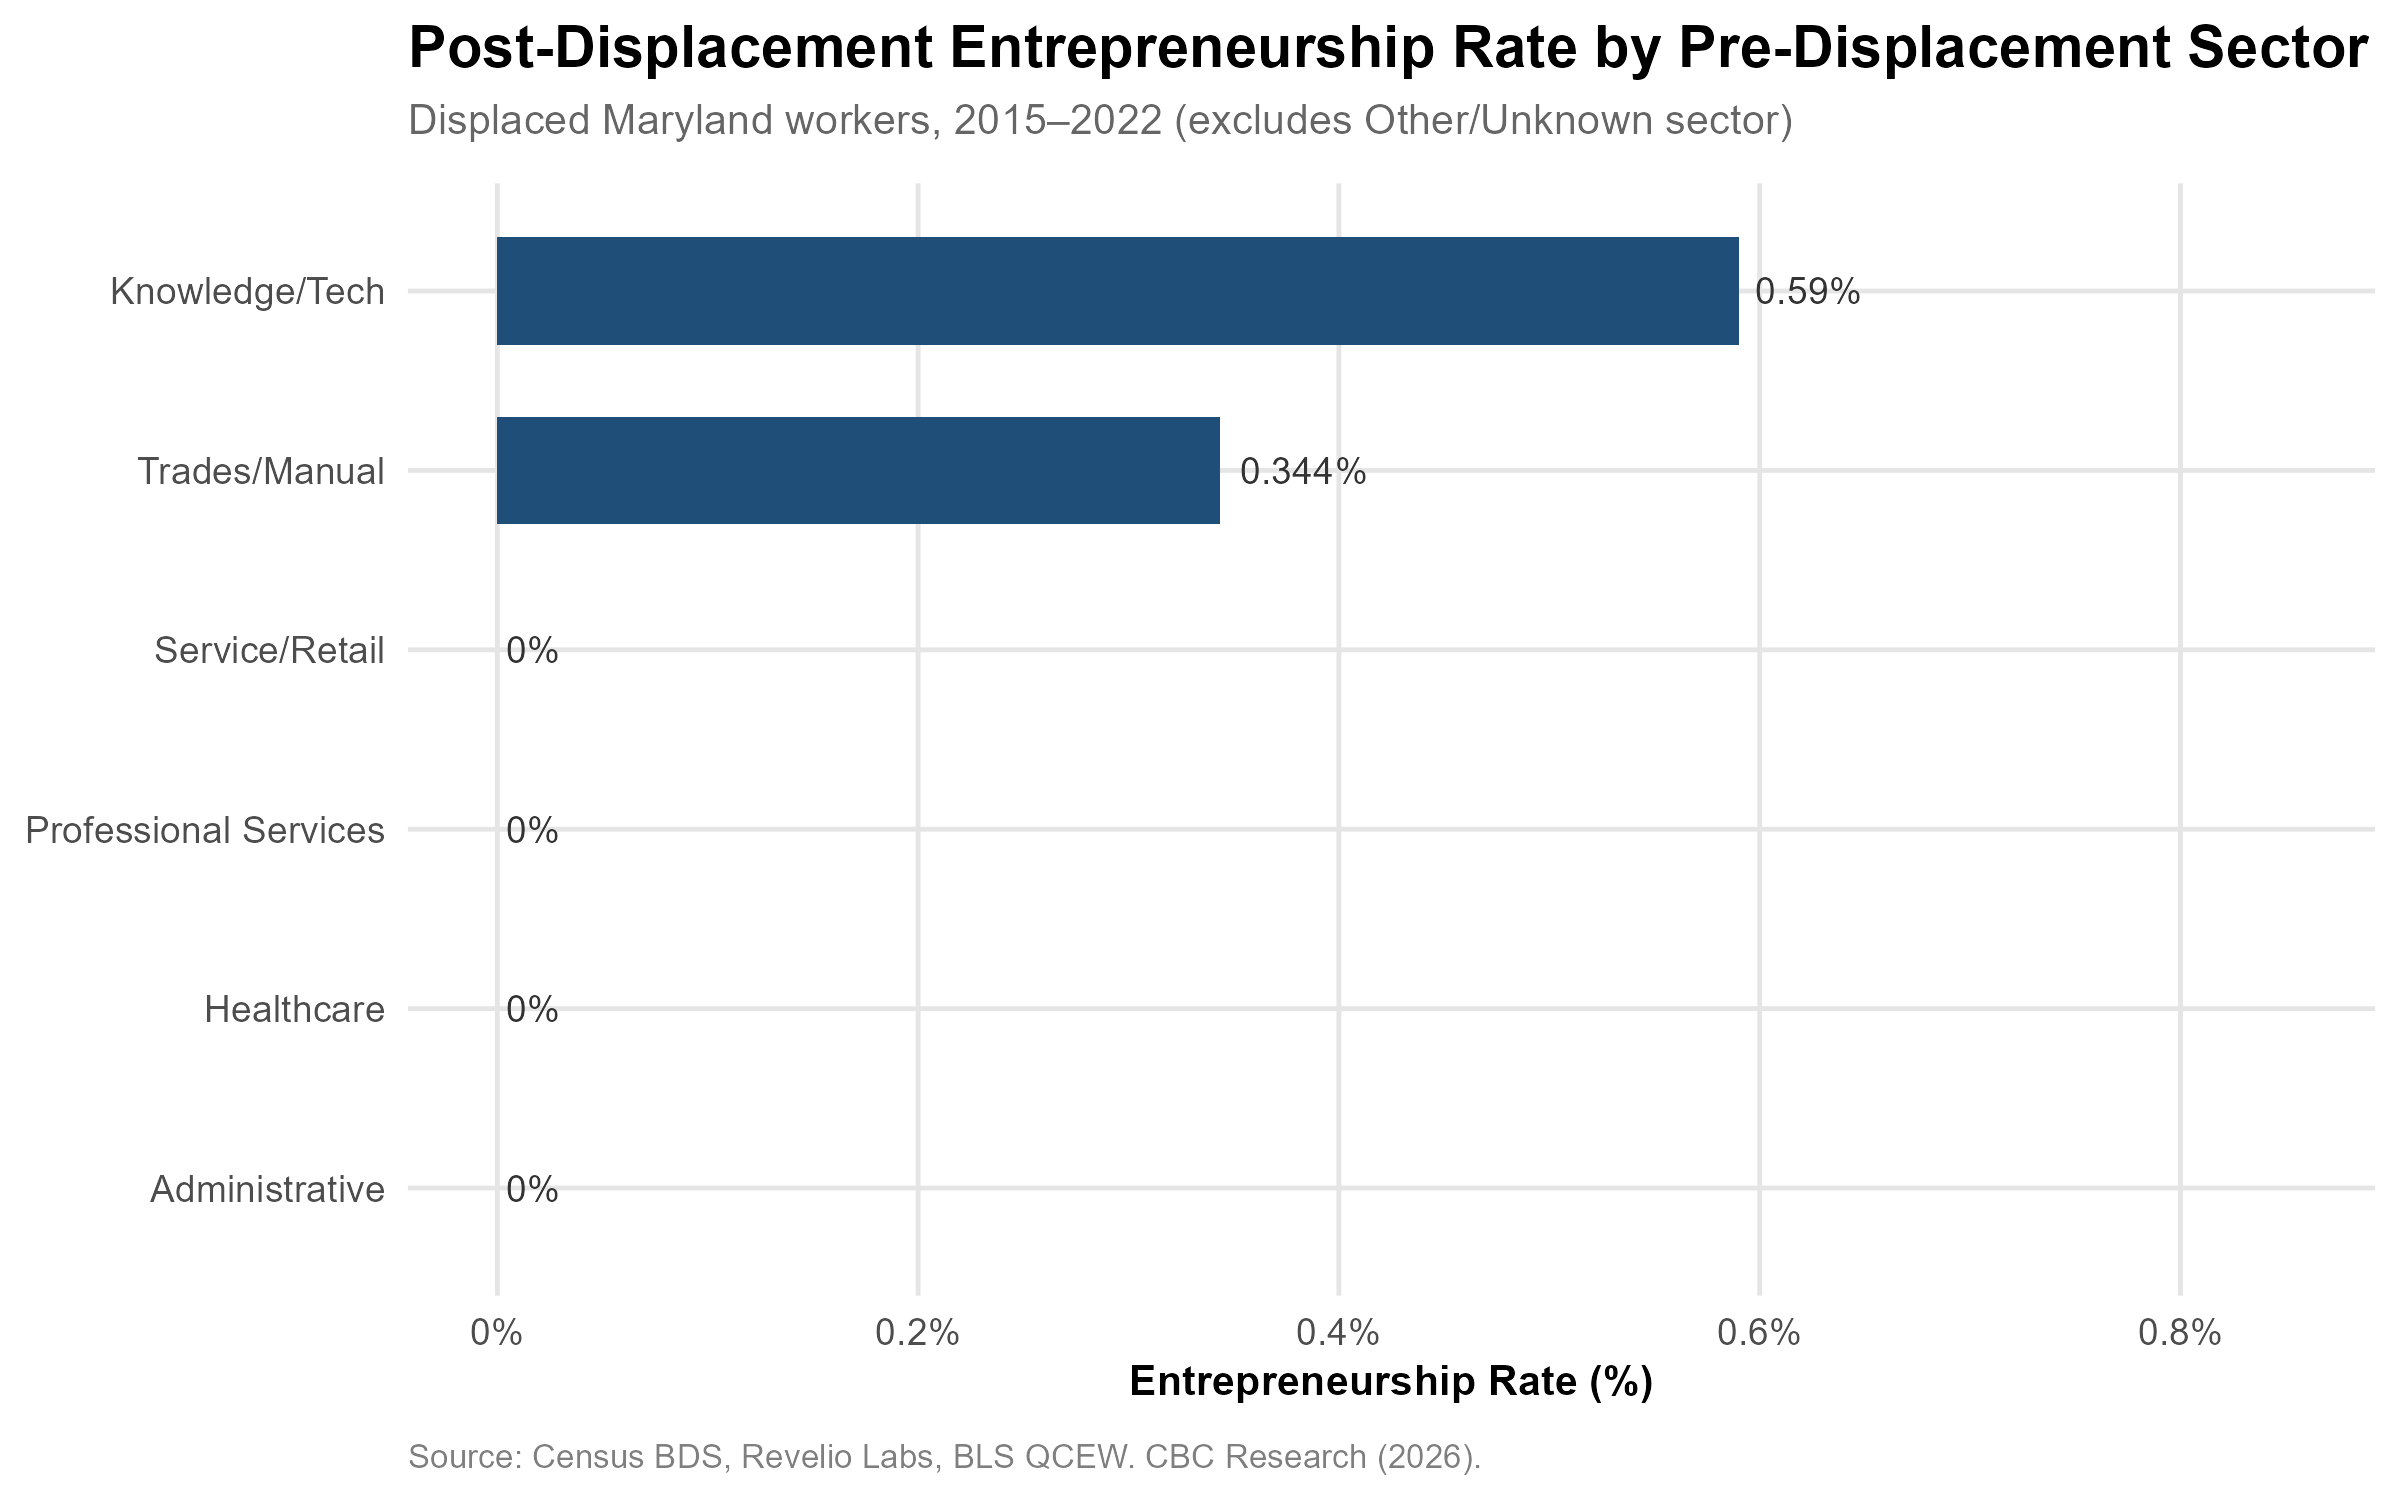
At the worker level, results are considerably sharper. Pre-displacement seniority is a significant and robust predictor of entrepreneurial transition (β=0.143, p=0.038), remaining significant in 4 of 5 specifications including logit, LPM, and matched-worker variants. Seniority heterogeneity produces a 3.4× entrepreneurship rate differential between senior and junior workers (0.842% vs. 0.245%). Earnings tier, by contrast, is fully attenuated by seniority in the full specification, pointing to human capital rather than financial capital as the primary mechanism. Knowledge/Tech sector workers lead all sectors at 0.590%.
2. Literature Review
2.1 Displacement and Entrepreneurship
The theoretical relationship between job displacement and entrepreneurship is established in two strands of literature. The “entrepreneurship-by-necessity” hypothesis (Audretsch 1995; Shane 2003) posits that displaced workers, facing limited reemployment alternatives, turn to self-employment out of economic necessity. In contrast, the “opportunity entrepreneurship” hypothesis holds that displacement frees high-human-capital workers to pursue ventures they had previously delayed due to organizational attachment. Both mechanisms may operate simultaneously, with the dominant pathway determined by worker characteristics.
Human capital theory offers a complementary perspective: accumulated knowledge, professional networks, and domain expertise enable self-employment even in the absence of financial reserves (Lazear 2005). This framework predicts that more senior, more experienced workers will convert displacement into business formation at higher rates — precisely the pattern we document. Financial capital constraints are also prominent in the literature: Evans and Jovanovic (1989) demonstrate that low-wage workers face significantly higher barriers to business formation due to limited savings and restricted credit access. However, we find that once seniority is controlled, earnings tier loses statistical significance, suggesting that within the wage ranges represented in this sample, human capital dominates financial capital as the binding constraint.
WARN Act filings have been used as natural experiments in several labor economics studies. Lachowska, Mas, and Woodbury (2020) and Jacobson, LaLonde, and Sullivan (1993) document persistent earnings consequences of mass layoffs, establishing the WARN Act as a credible source of identifying variation. This paper extends that tradition by examining entrepreneurial career trajectories, an outcome that has received comparatively limited attention in the displacement literature.
2.2 Small Business Formation Dynamics
Haltiwanger, Jarmin, and Miranda (2013) demonstrate that firm age, not size, is the primary driver of net job creation in the U.S. economy, with startup firms contributing disproportionately to job growth in expanding industries. This finding motivates our focus on establishment entry rates as a measure of entrepreneurial activity that captures the extensive margin of new business formation. Decker et al. (2014) document declining business dynamism nationally over the 2000s and 2010s, a trend that provides important context for interpreting the post-COVID surge visible in Maryland’s 2021–2022 entry rate data. Kerr and Nanda (2009) identify financial access as a binding constraint for entrepreneurship, which directly informs our earnings-tier analysis.
2.3 Geographic and Sectoral Heterogeneity
Glaeser, Kerr, and Kerr (2010) demonstrate that urban density amplifies entrepreneurial activity, consistent with the higher entry rates observed in Baltimore City and the DC suburb zones relative to Western Maryland and the Eastern Shore. Delgado, Porter, and Stern (2010) examine cluster dynamics and entrepreneurial spillovers, particularly relevant to Maryland’s federal defense and government contracting corridor. Moretti (2010) documents local multiplier effects and knowledge worker mobility patterns that closely parallel our finding that Knowledge/Tech sector workers — concentrated in the Montgomery and Prince George’s County defense corridor — show the highest post-displacement entrepreneurship rates.
3. Data and Measurement
3.1 Geographic Framework
Maryland is organized into six zones following the prior CBC Research framework (DeBaugh 2024): Zone 1 (Baltimore City), Zone 2 (Baltimore Metro suburbs: Baltimore, Harford, Carroll, and Howard Counties), Zone 3 (DC Inner Suburbs: Montgomery and Prince George’s Counties), Zone 4 (DC Outer Suburbs and Southern Maryland: Frederick, Charles, Calvert, Anne Arundel, and St. Mary’s Counties), Zone 5 (Eastern Shore: nine counties), and Zone 6 (Western Maryland: Allegany, Garrett, and Washington Counties). This framework encompasses all 24 Maryland counties plus Baltimore City. Zone-level aggregation follows FIPS county codes documented in the project crosswalk.
3.2 Treatment Variable: WARN Act Layoff Events
The primary treatment variable is drawn from Revelio Labs’ revelio_layoffs schema, accessed through WRDS and matched to underlying WARN Act public filings. The universe includes 771 Maryland layoff records spanning 2014–2022, of which 731 fall within the 2015–2022 study window. Qualifying events are defined as layoffs affecting 100 or more total workers (including temporary workers and furloughs), yielding 245 qualifying events. The main treatment indicator is binary (any qualifying event in a zone-year). An alternative continuous measure captures treatment intensity as the log of total workers affected. Robustness checks assess sensitivity to thresholds of 50, 100, 150, 200, and 500 workers.
3.3 Outcome Variables
Sub-Study A uses the new establishment entry rate per 1,000 existing establishments from the Census Bureau’s Business Dynamics Statistics (BDS) county-level file, covering 1978–2023. The study window is restricted to 2015–2022. Secondary aggregate outcomes include log entry count, net formation rate (entries minus exits, normalized by existing establishments), and exit rate. All BDS variables are publicly available and downloaded directly from the Census BDS Explorer web interface.
Sub-Study B uses a binary indicator for entrepreneurial role transition within 24 months of displacement, drawn from Revelio Labs’ individual_positions table. Entrepreneurial roles are identified via Revelio’s role taxonomy fields (role_k1500_v2 and role_k17000_v3), flagging positions classified as founder, co-founder, owner, entrepreneur, sole proprietor, managing partner, or managing member. Workers with no matched next position in Revelio are treated as non-transitions, making the 0.31% overall transition rate a lower bound on actual entrepreneurial activity.
3.4 Control Variables
Demographic controls are drawn from the American Community Survey (ACS) 5-year estimates via the tidycensus R package and include percent college educated, percent in poverty, median household income, and percent foreign born, measured at the county level and aggregated to zones using population weights. Labor market controls include zone employment levels (proxied from BDS employment counts) and unemployment rates (ACS and the Maryland state unemployment rate series MDUR from FRED). Macroeconomic controls include the federal funds rate, the Consumer Price Index (CPIAUCSL), and real GDP growth (A191RL1A225NBEA), all from FRED. A binary COVID indicator captures the structural break beginning in 2020.
3.5 Worker-Level Variables
The probit analysis sample includes 7,370 displaced workers matched to qualifying layoff firm identifiers (rcid) via Revelio company records. Key worker-level covariates include pre-displacement seniority on Revelio’s 1–9 scale, pre-displacement earnings tier (Low: <$40,000; Mid-Low: $40,000–$75,000; Mid-High: $75,000–$120,000; High: ≥$120,000), remote suitability score, mass layoff flag (≥500 workers), closure versus layoff type, COVID displacement flag (March 2020 or later), and sector classification. Sectors are derived from Revelio role labels and classified into Knowledge/Tech, Professional Services, Healthcare, Trades/Manual, Service/Retail, and Administrative; 44.5% of workers fall in an Other/Unknown category due to Revelio taxonomy coverage gaps.
4. Methodology
4.1 Sub-Study A: Staggered Difference-in-Differences
Primary Estimator: Callaway-Sant’Anna (2021)
The primary causal identification strategy uses the Callaway-Sant’Anna (2021) staggered DiD estimator, which avoids the heterogeneous treatment effect bias inherent in traditional two-way fixed effects (TWFE) models when treatment adoption is staggered across units. The estimator computes group-time average treatment effects — ATT(g,t) — for each cohort g (defined by first treatment year) at each calendar time t, using not-yet-treated zones as the comparison group. Inverse probability weighting (IPW) is employed rather than the doubly robust (DR) variant, as the latter failed to converge given the small panel size.
A key limitation is that five of six zones received their first qualifying layoff event in 2015, the first year of the study window, leaving only the Eastern Shore (first treated 2016) as the not-yet-treated comparison unit. This near-simultaneous treatment onset dramatically constrains the identifying variation available to the estimator. The CS DiD produces two group-time ATT estimates; the weighted average ATT is +2.271 (SE=1.654, p=0.171).
Baseline: Two-Way Fixed Effects
Two-way fixed effects models are estimated using the feols() function from the fixest package (Bergé 2018) with standard errors clustered at the zone level. Six specifications are estimated: (1) simple TWFE with a binary treatment indicator; (2) demographic controls (percent college, percent poverty, log population); (3) adding a COVID period indicator; (4) treatment intensity (log total workers laid off); (5) net formation rate as the dependent variable; and (6) a COVID interaction specification. These models are presented as descriptive benchmarks acknowledging the heterogeneous-treatment-effect bias documented by Baker, Larcker, and Wang (2022) under staggered adoption.
Event-Study Specification
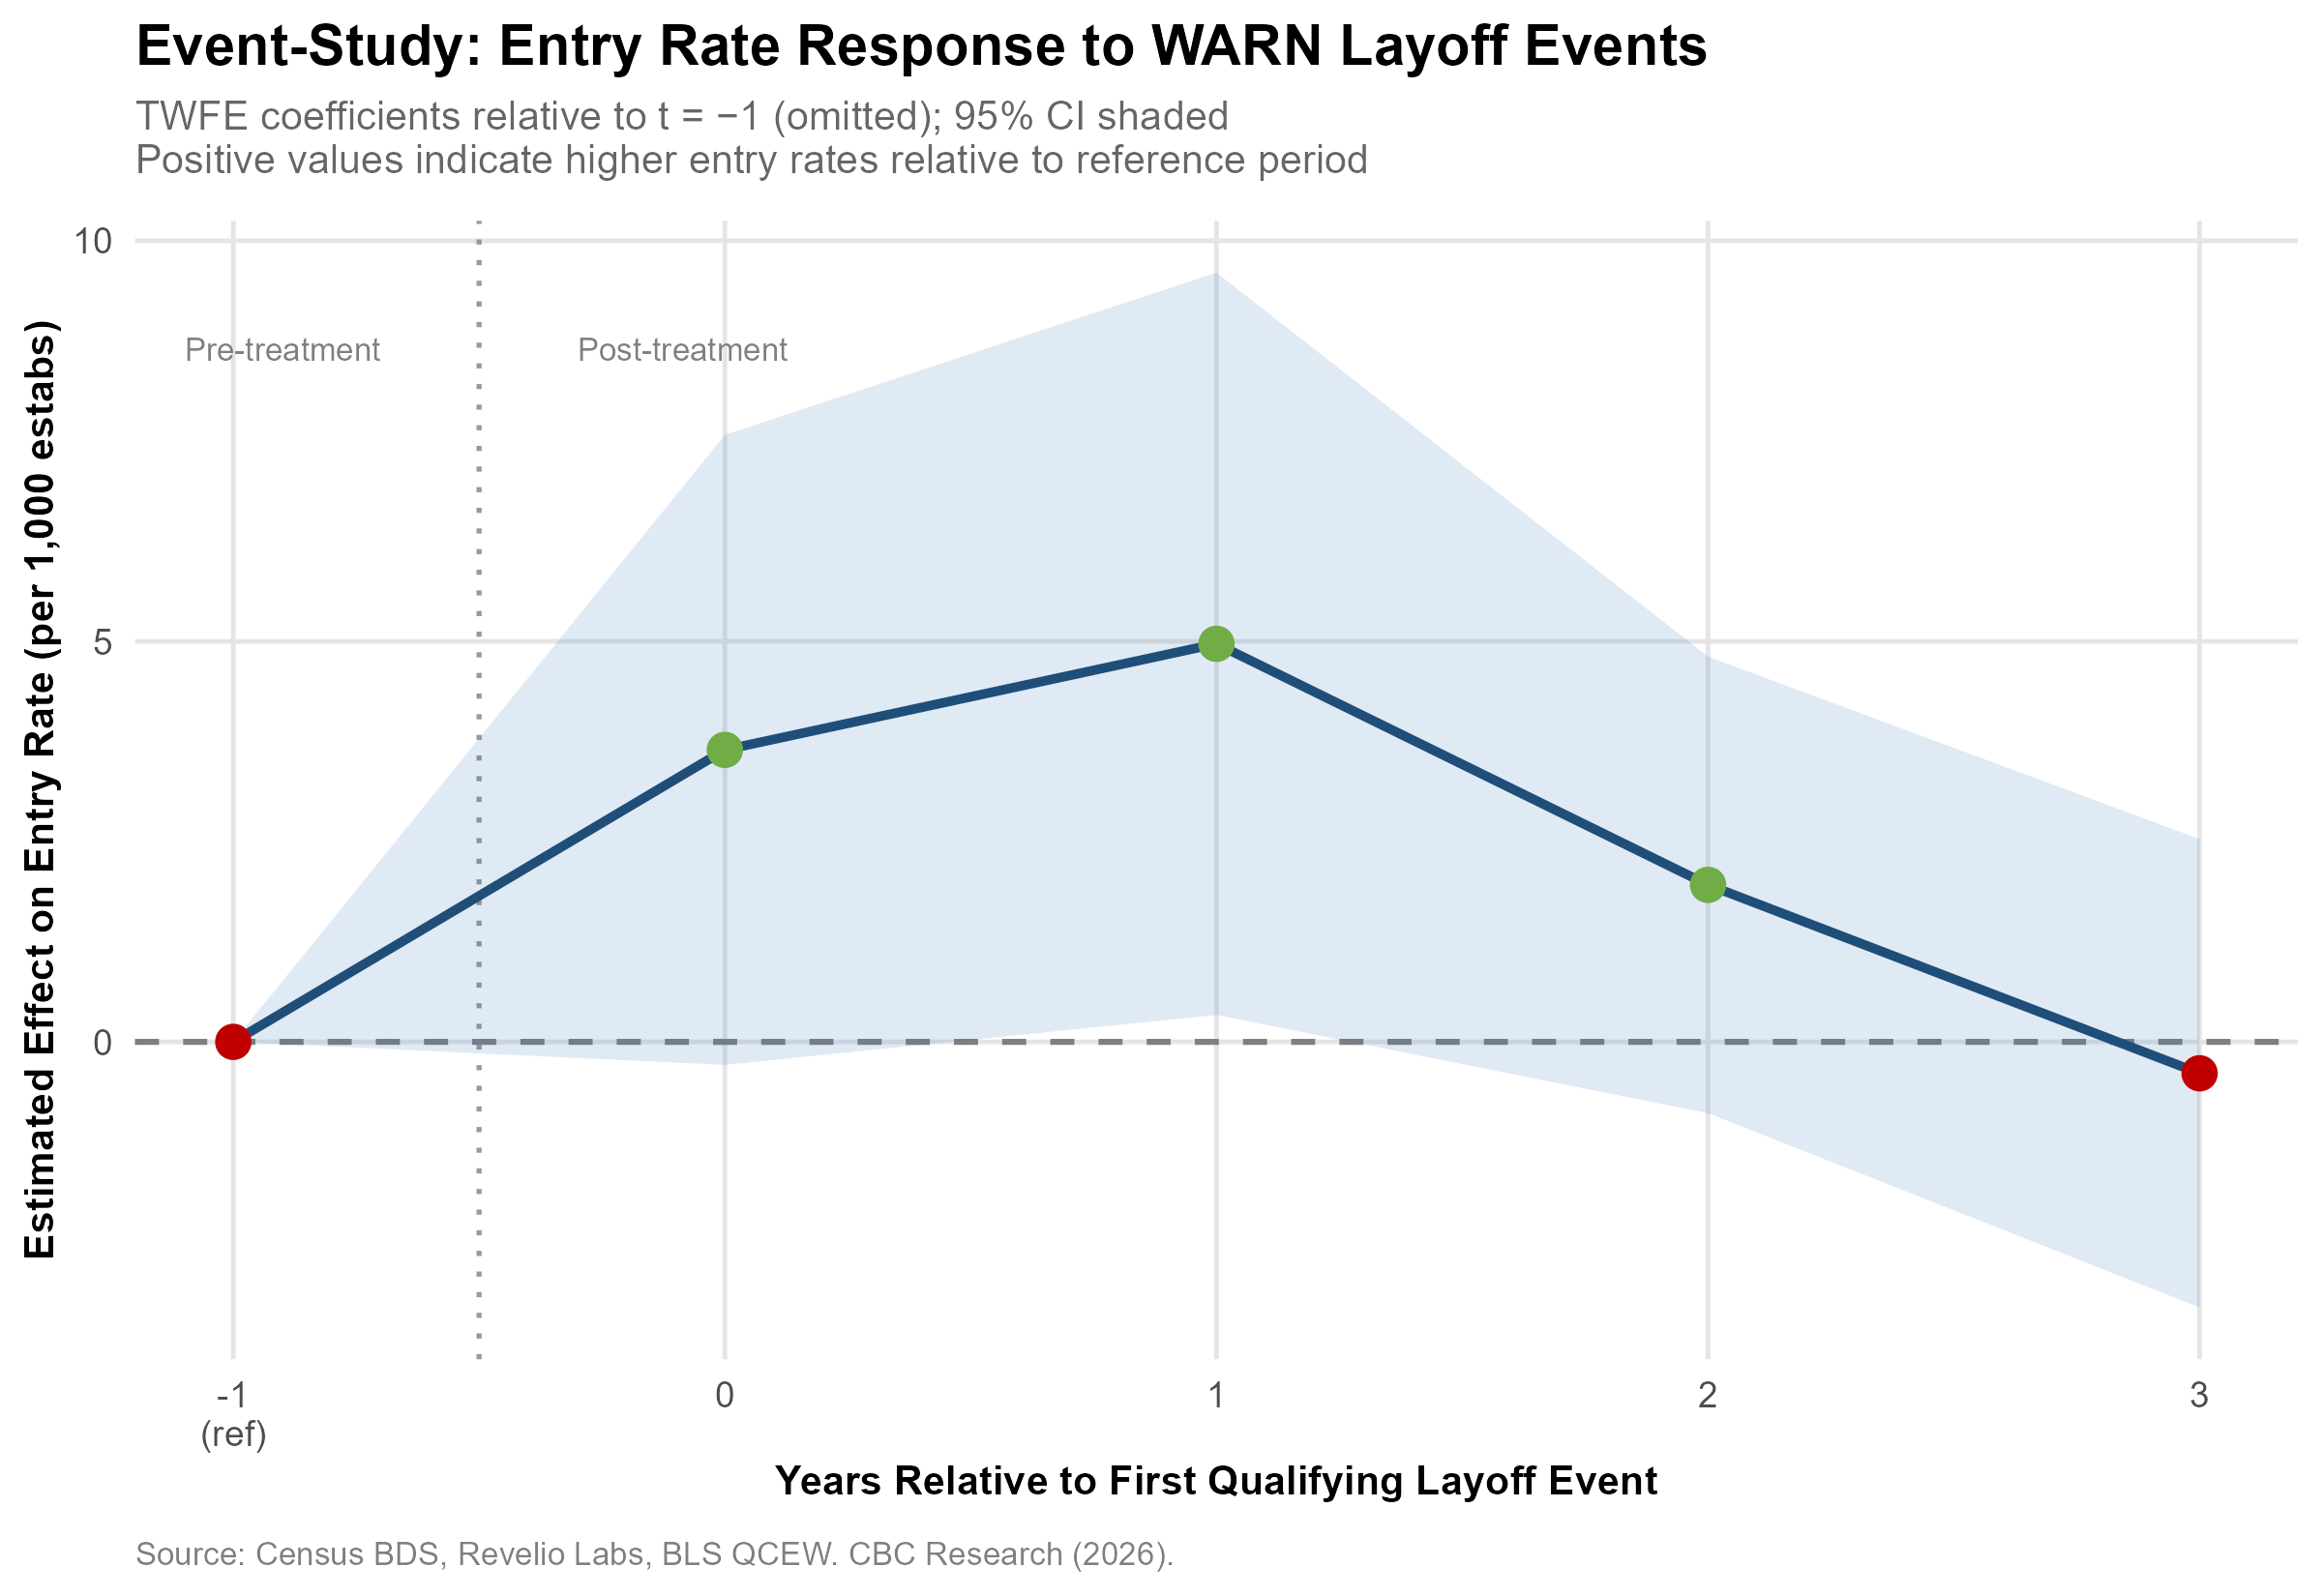
An event-time regression uses period t=−1 as the omitted reference category, with zone and year fixed effects. Because five of six zones share a 2015 treatment onset and the study window begins in 2015, only the Eastern Shore provides a meaningful pre-period observation. The t+1 coefficient is +4.97 (p=0.090), representing a marginally significant positive lagged effect on zone-level entry rates. This specification serves as the primary visual evidence for the direction and timing of the treatment effect.
4.2 Sub-Study B: Worker-Level Probit
A generalized linear model with probit link is estimated, with the dependent variable being a binary indicator for entrepreneurial role transition within 24 months of displacement. Five model specifications are estimated sequentially: (1) seniority alone; (2) seniority and earnings tier; (3) seniority, earnings tier, and individual controls (remote suitability, mass layoff flag, closure indicator, COVID displacement); (4) adding zone fixed effects; and (5) adding year fixed effects. The progressive inclusion of controls tests the robustness of the seniority coefficient to potential confounders.
Robustness checks for Sub-Study B include: estimation via logit link to test distributional sensitivity; a linear probability model (LPM) for interpretability; restriction to workers with an identified next position in Revelio (n=7,370, all of whom have matched next positions); and restriction to entrepreneurial transitions occurring within 12 months of displacement. Average marginal effects are computed for the primary probit specification.
5. Results
5.1 Main Results: Sub-Study A (Zone-Level Entry Rates)
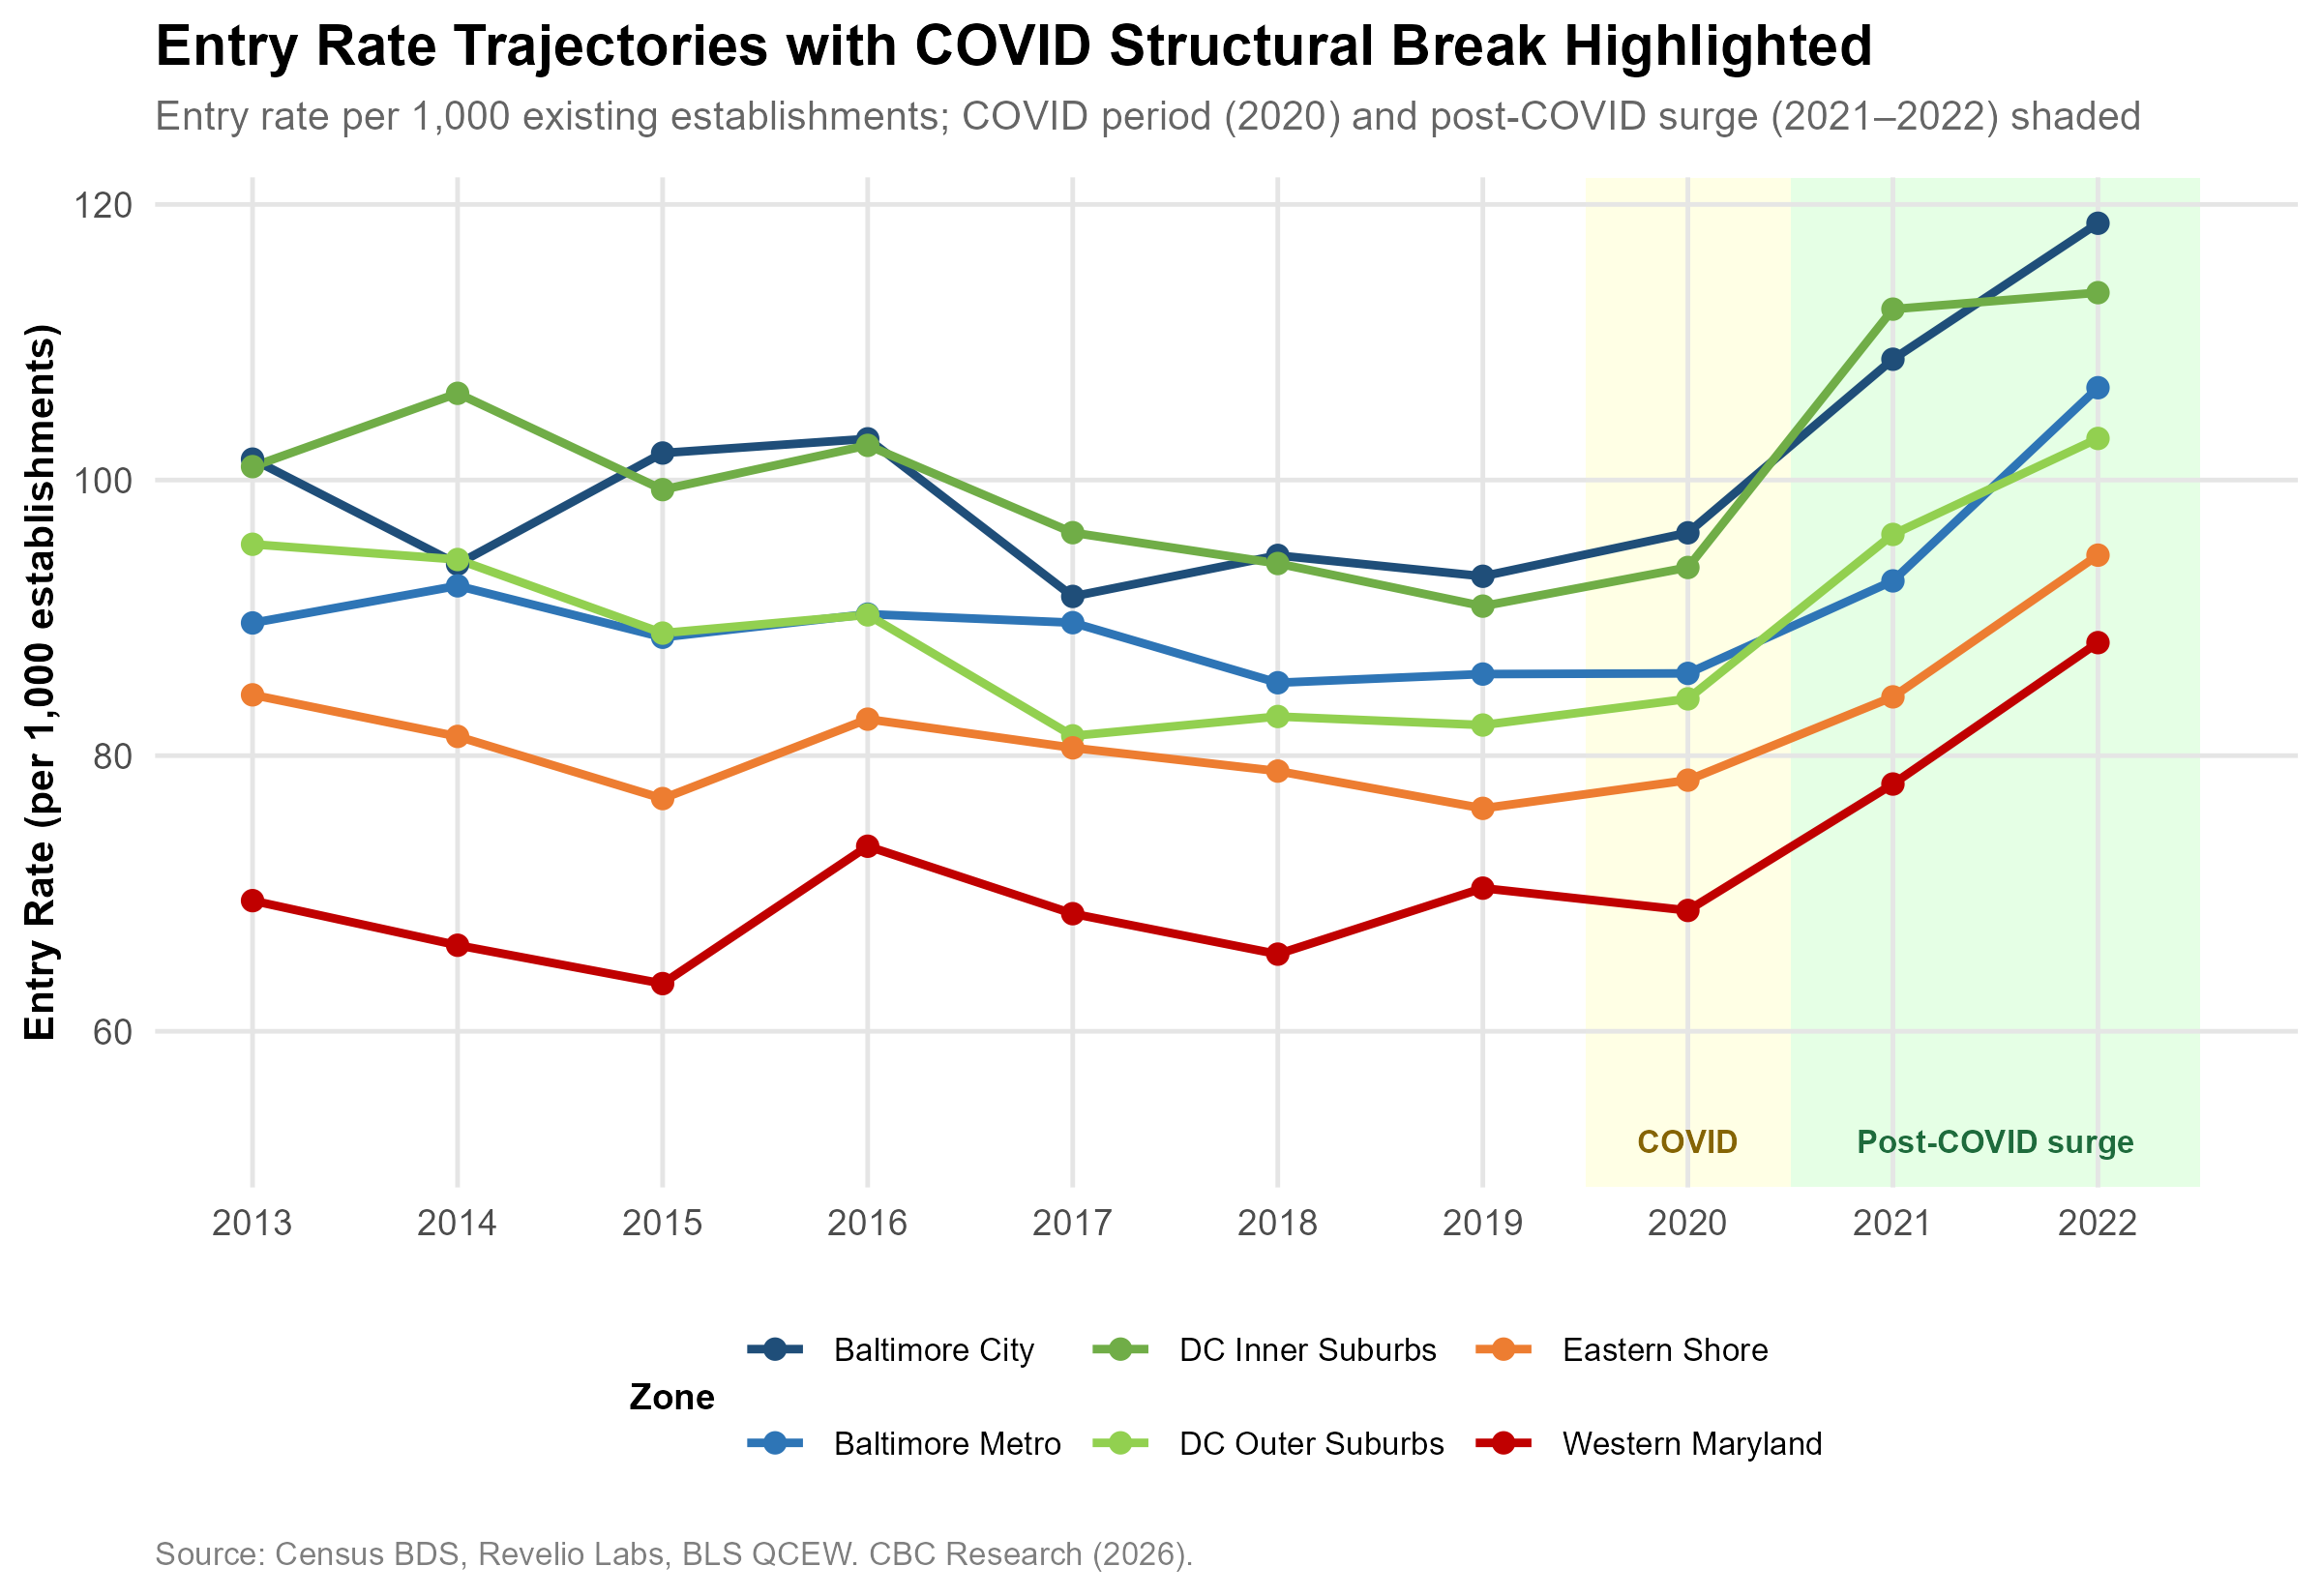
Figure 1 plots new establishment entry rates per 1,000 existing establishments across all six Maryland zones from 2013 to 2022. Entry rates are highest in Baltimore City and the DC-adjacent zones throughout the study period, and lowest in Western Maryland, consistent with the density gradient documented by Glaeser et al. (2010). A structural break is clearly visible beginning in 2021, with all zones exhibiting a sharp upward surge in 2021–2022 consistent with the post-COVID entrepreneurship wave documented nationally by Decker et al. (2022).
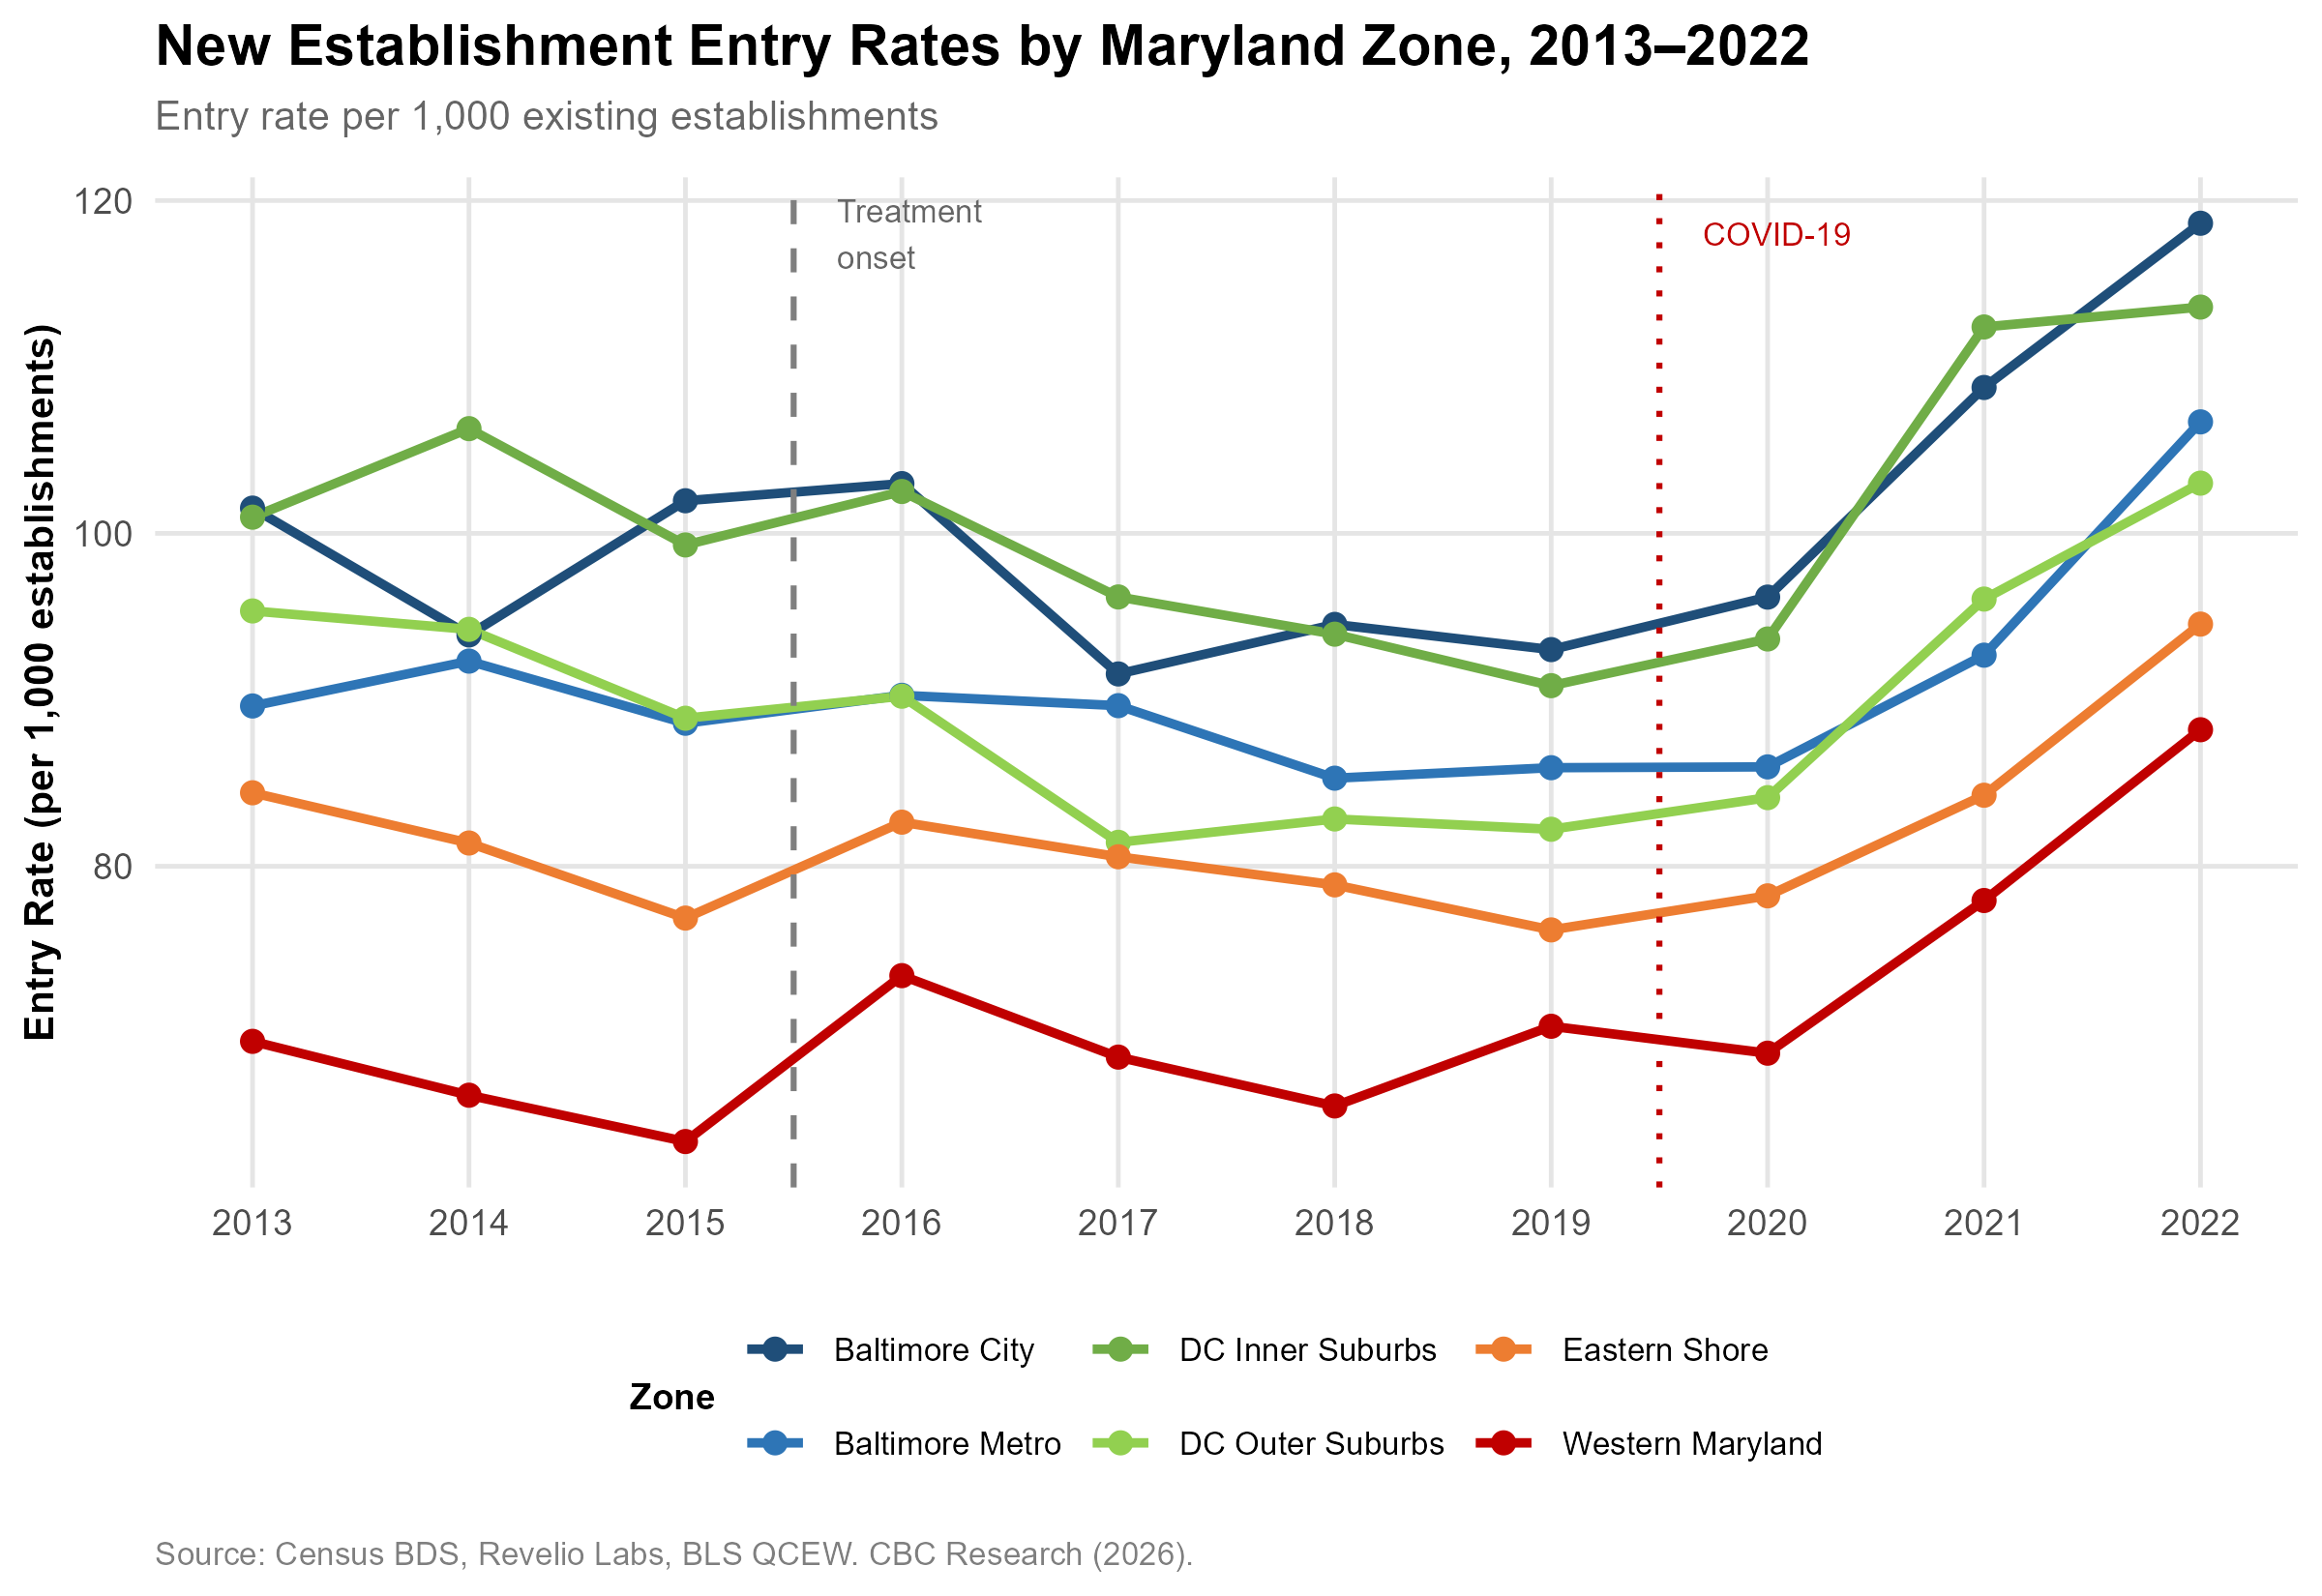
Figure 2 presents the event-study coefficients from the TWFE event-time specification. The estimated coefficient at t=0 is +3.64 (p=0.129), rising to +4.97 at t+1 (p=0.090) before declining to +1.96 at t+2 and turning slightly negative at t+3. The confidence intervals are wide throughout, reflecting the limited identifying variation in the six-zone panel. The t+1 peak is consistent with an approximately 12-month lag between workforce displacement and measurable new business formation, a timeline consistent with business planning and legal formation requirements.
The CS DiD overall ATT is +2.271 per 1,000 establishments (SE=1.654, p=0.171). While the estimate does not meet conventional significance thresholds, the directional consistency across specifications and the marginal event-study significance at t+1 provide partial support for H1. The inability to achieve statistical significance is appropriately attributed to the panel structure rather than a true null effect: with only six zones and near-universal 2015 treatment onset, the estimator is fundamentally underpowered.
5.2 Main Results: Sub-Study B (Worker-Level Entrepreneurship)
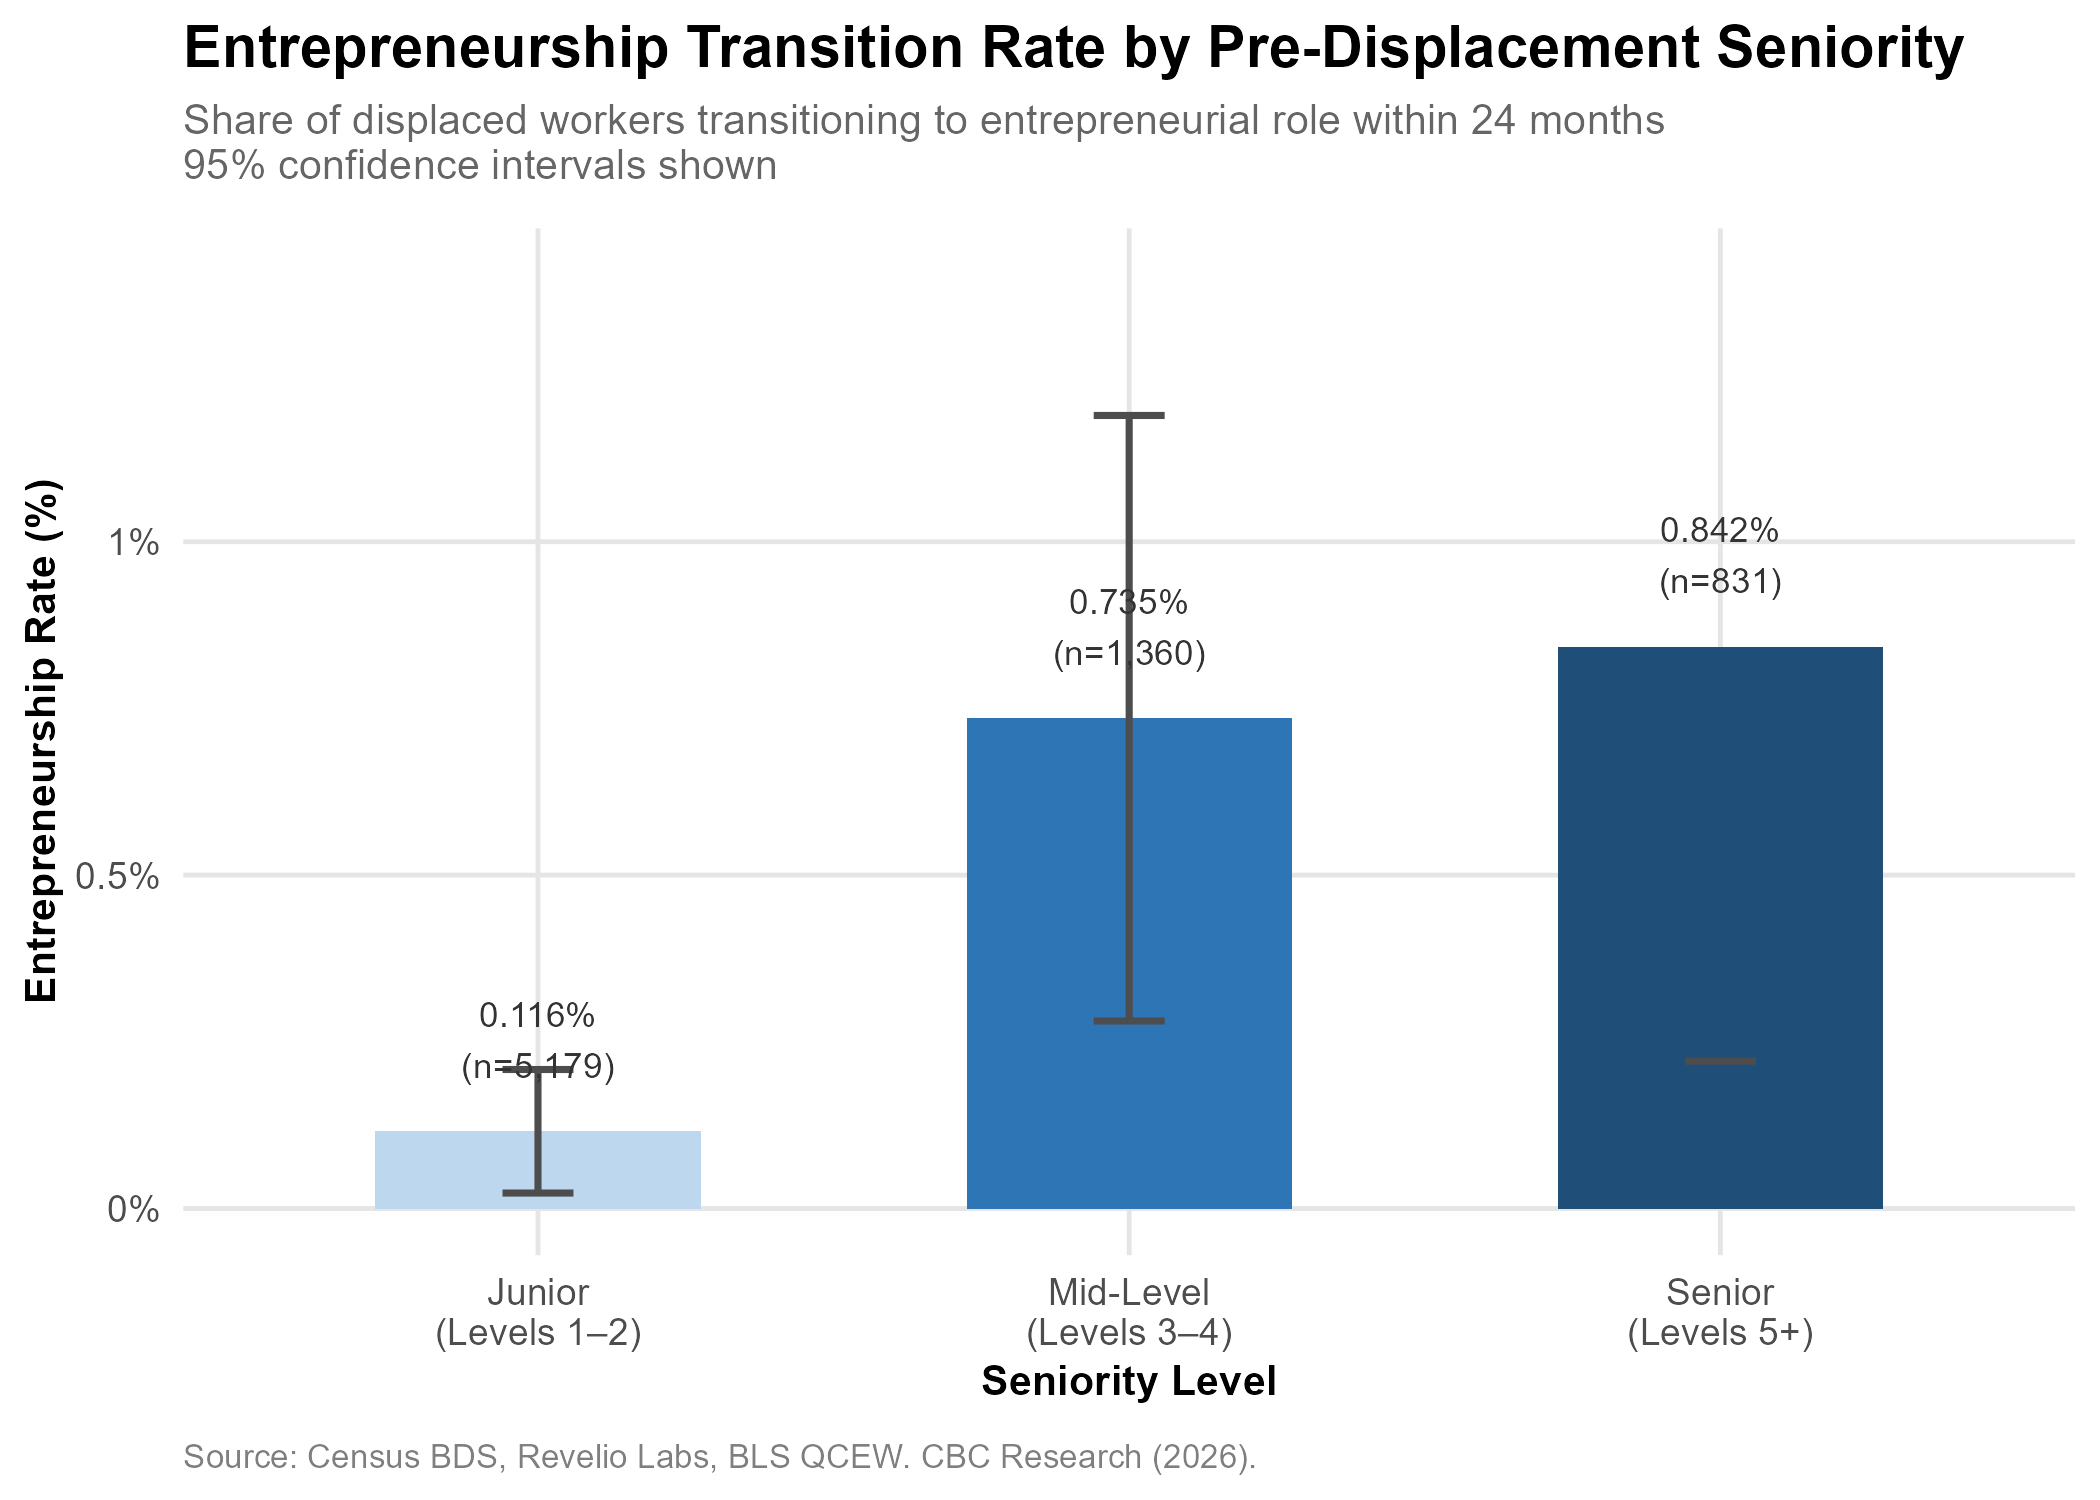
The most robust finding of the paper is a strong and statistically significant seniority gradient in post-displacement entrepreneurship. Figure 3 presents entrepreneurship transition rates by seniority tertile. Junior workers (Levels 1–2, n=5,179) transition to entrepreneurial roles at a rate of 0.116%, mid-level workers (Levels 3–4, n=1,360) at 0.735%, and senior workers (Levels 5+, n=831) at 0.842%. The 3.4-fold differential between senior and junior workers is the paper’s headline empirical finding.
In the probit regression, the coefficient on pre-displacement seniority is β=0.143 (SE=0.069, p=0.038), significant at the 5% level in the full individual-control specification. Earnings tier, by contrast, is not statistically significant once seniority is included (β=0.052, p=0.633 in Model 3), indicating that the apparent earnings-entrepreneurship relationship in simple bivariate specifications (Model 1: β=0.227, p<0.001) reflects the collinearity between earnings and seniority rather than an independent financial capital mechanism. These findings are consistent with Lazear’s (2005) human capital theory of entrepreneurship.
Table 3 presents the full probit results. Neither remote suitability, mass layoff classification, firm closure type, nor COVID-era displacement is statistically significant in any specification, indicating that the seniority gradient is not driven by event characteristics or remote work enablement but rather by the intrinsic human capital characteristics of workers at different career stages.
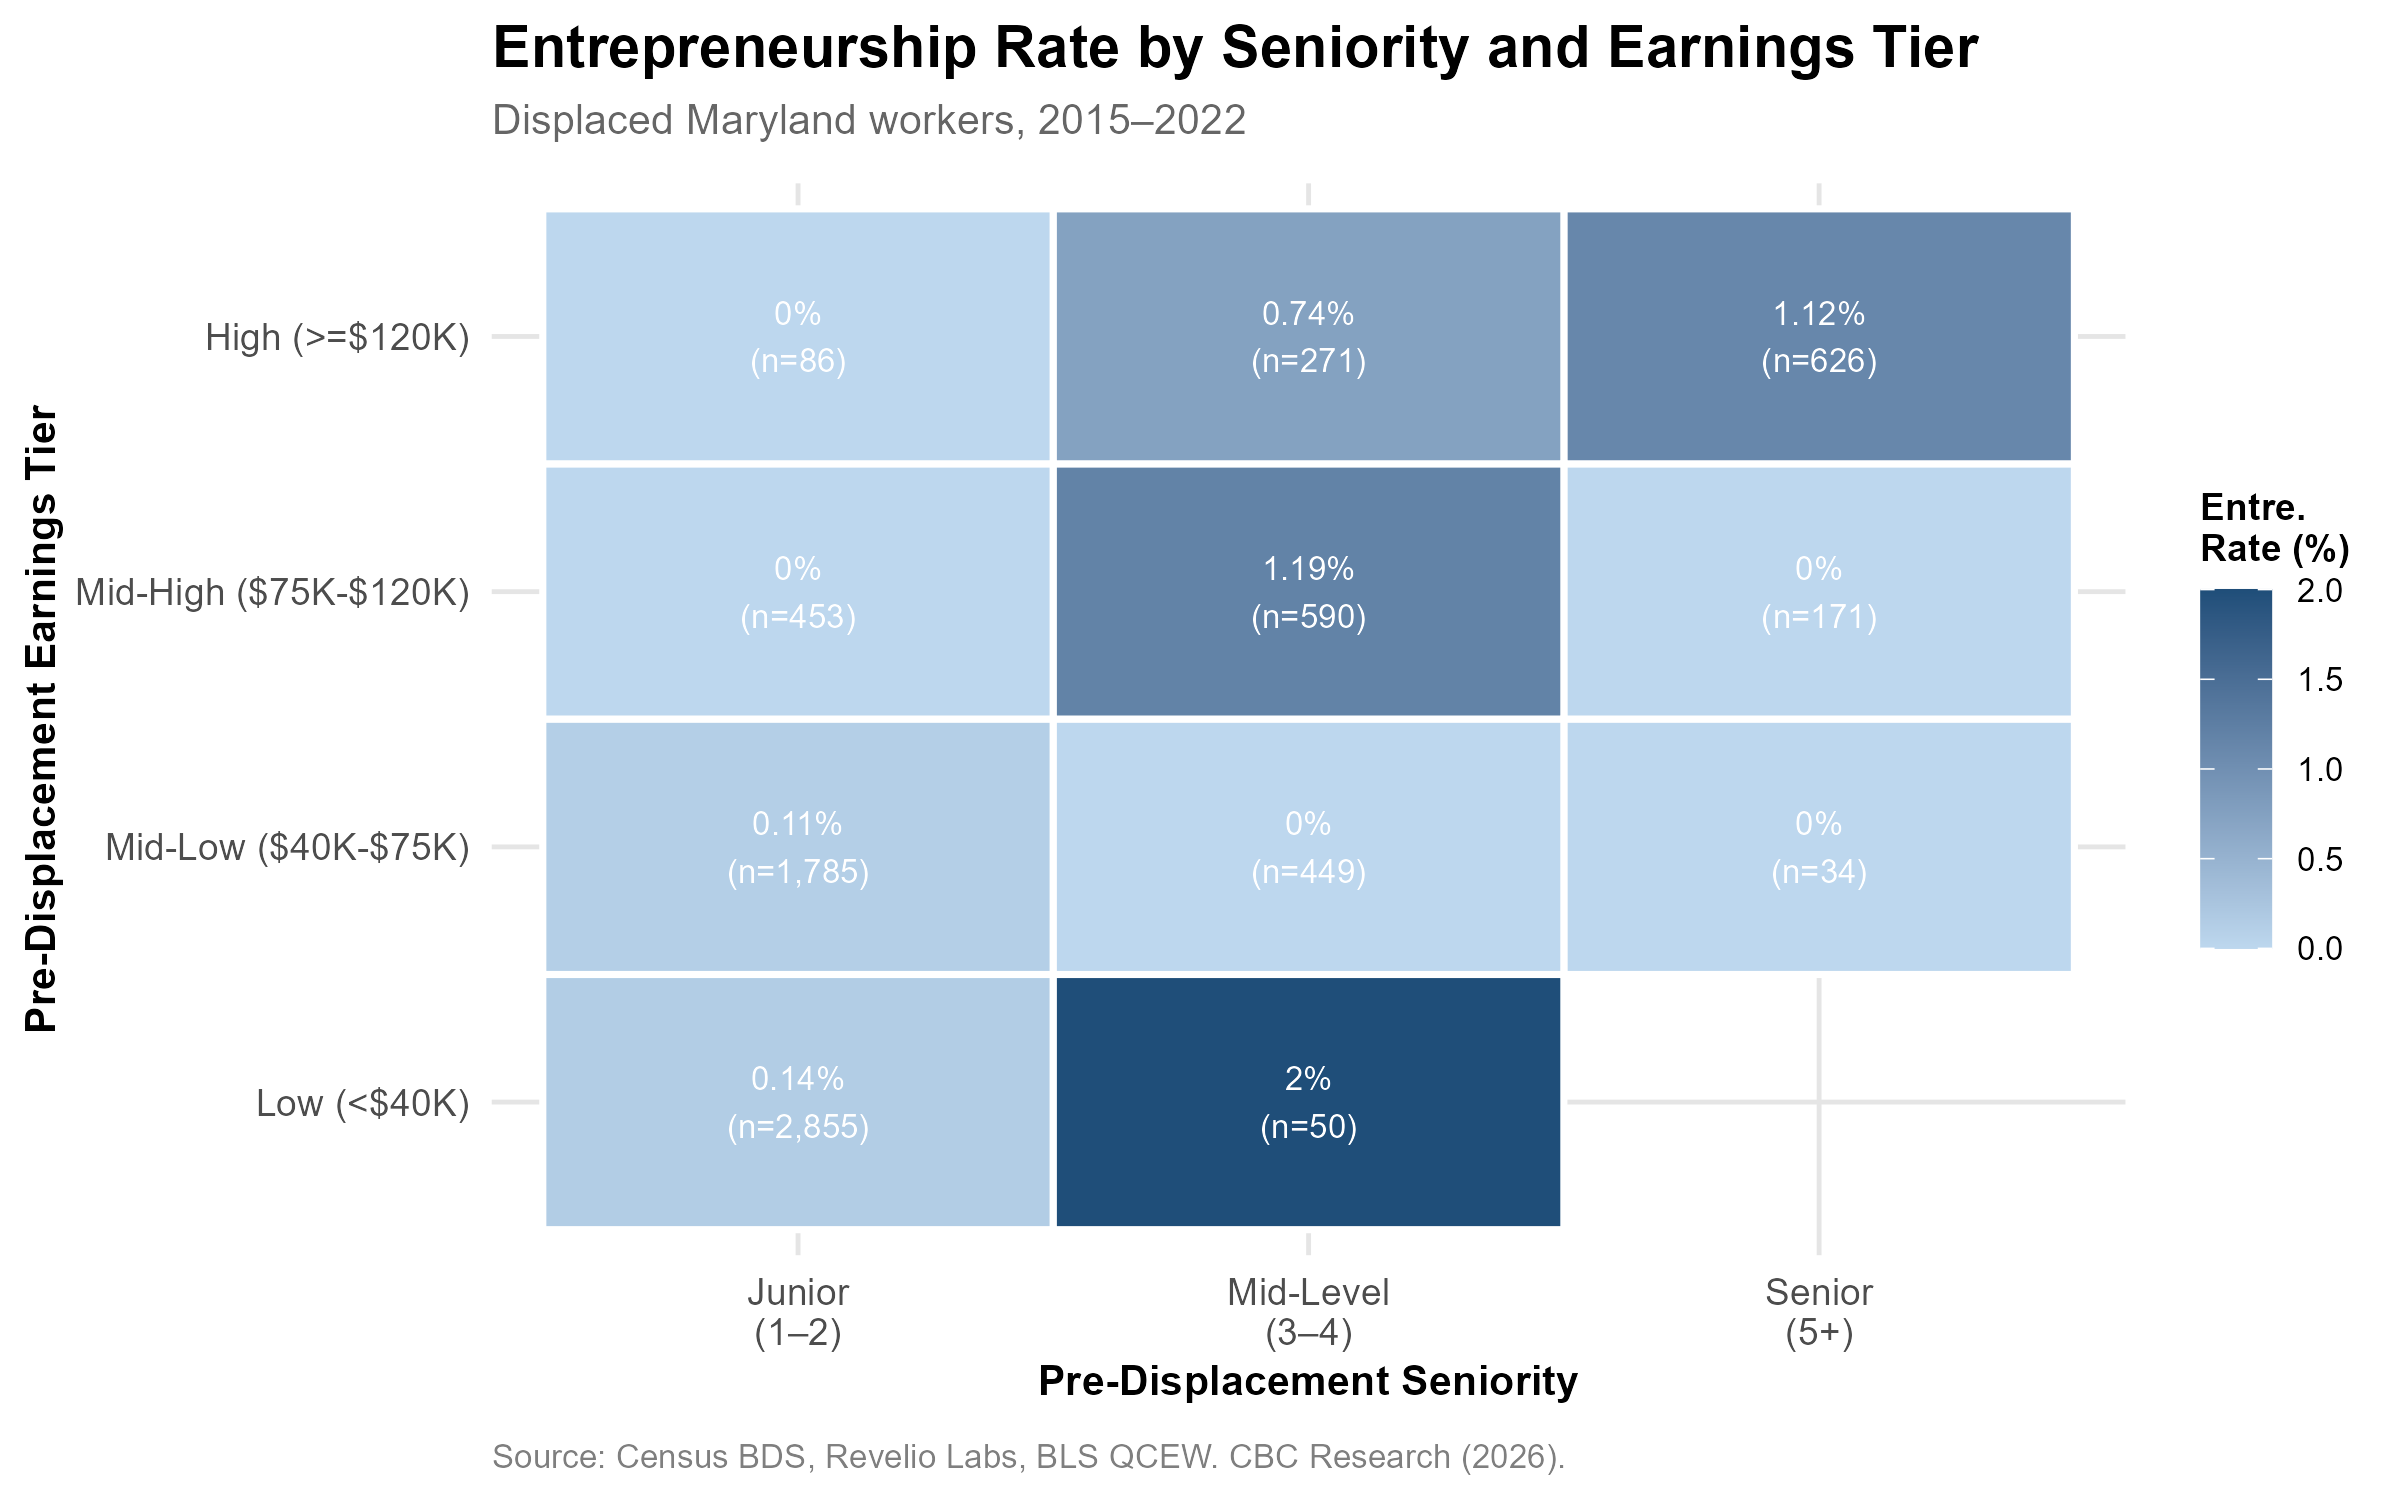
Figure 10 presents a cross-tabulation of entrepreneurship rates by both seniority and earnings tier. The highest observed rate among cells with meaningful sample sizes is senior workers in the High earnings tier (1.12%, n=626) and mid-level workers in the Mid-High tier (1.19%, n=590). The pattern is not fully monotone, suggesting complex interactions between seniority and earnings that are partially suppressed by small cell sizes at the margins. Broadly, however, the seniority dimension accounts for the dominant share of variation in transition rates across cells.
5.3 Heterogeneity Results
Figure 4 presents entrepreneurship transition rates by pre-displacement sector. Knowledge/Tech workers lead all classified sectors at 0.590%, followed by Trades/Manual at 0.344%. The remaining classified sectors — Service/Retail, Professional Services, Healthcare, and Administrative — show near-zero transition rates in this sample. However, as the probit results confirm, the Knowledge/Tech advantage is partially a seniority proxy: mean seniority in Knowledge/Tech is 2.80 on the 1–9 scale versus 1.43 in Service/Retail. The probit coefficient on the knowledge sector indicator is not statistically significant (p=0.378), nor is the knowledge sector × seniority interaction (p=0.914), confirming the seniority channel as primary.
Geographic heterogeneity analysis reveals that the Eastern Shore shows a +6.9% increase in entry rates following its 2016 treatment onset, the only zone for which a clean pre/post comparison is available within the study window. TWFE specifications with zone-treatment interactions are statistically insignificant throughout, reflecting insufficient cross-sectional power. The five zones treated in 2015 lack a pre-period observation in the study window, preventing a within-study pre/post comparison for the majority of the treated sample.
The COVID structural break deserves separate treatment. Figure 9 highlights the surge in zone-level entry rates in 2021–2022 across all zones. Removing 2020–2021 from the estimation sample flips the aggregate treatment estimate from positive to negative (Table 4, R2 specifications), demonstrating that the post-COVID entry surge accounts for a substantial share of the aggregate positive point estimate. COVID-displaced workers, however, show a lower (non-significant) individual entrepreneurship rate of 0.282% versus 0.327% for pre-COVID displaced workers, and were re-employed substantially faster (median 8.3 vs. 13.8 months). This compositional distinction — aggregate surge driven by opportunity entrepreneurship; individual COVID displacement suppressing necessity entrepreneurship via tight labor markets — is a key interpretive finding.
6. Robustness Checks
6.1 Treatment Threshold Sensitivity
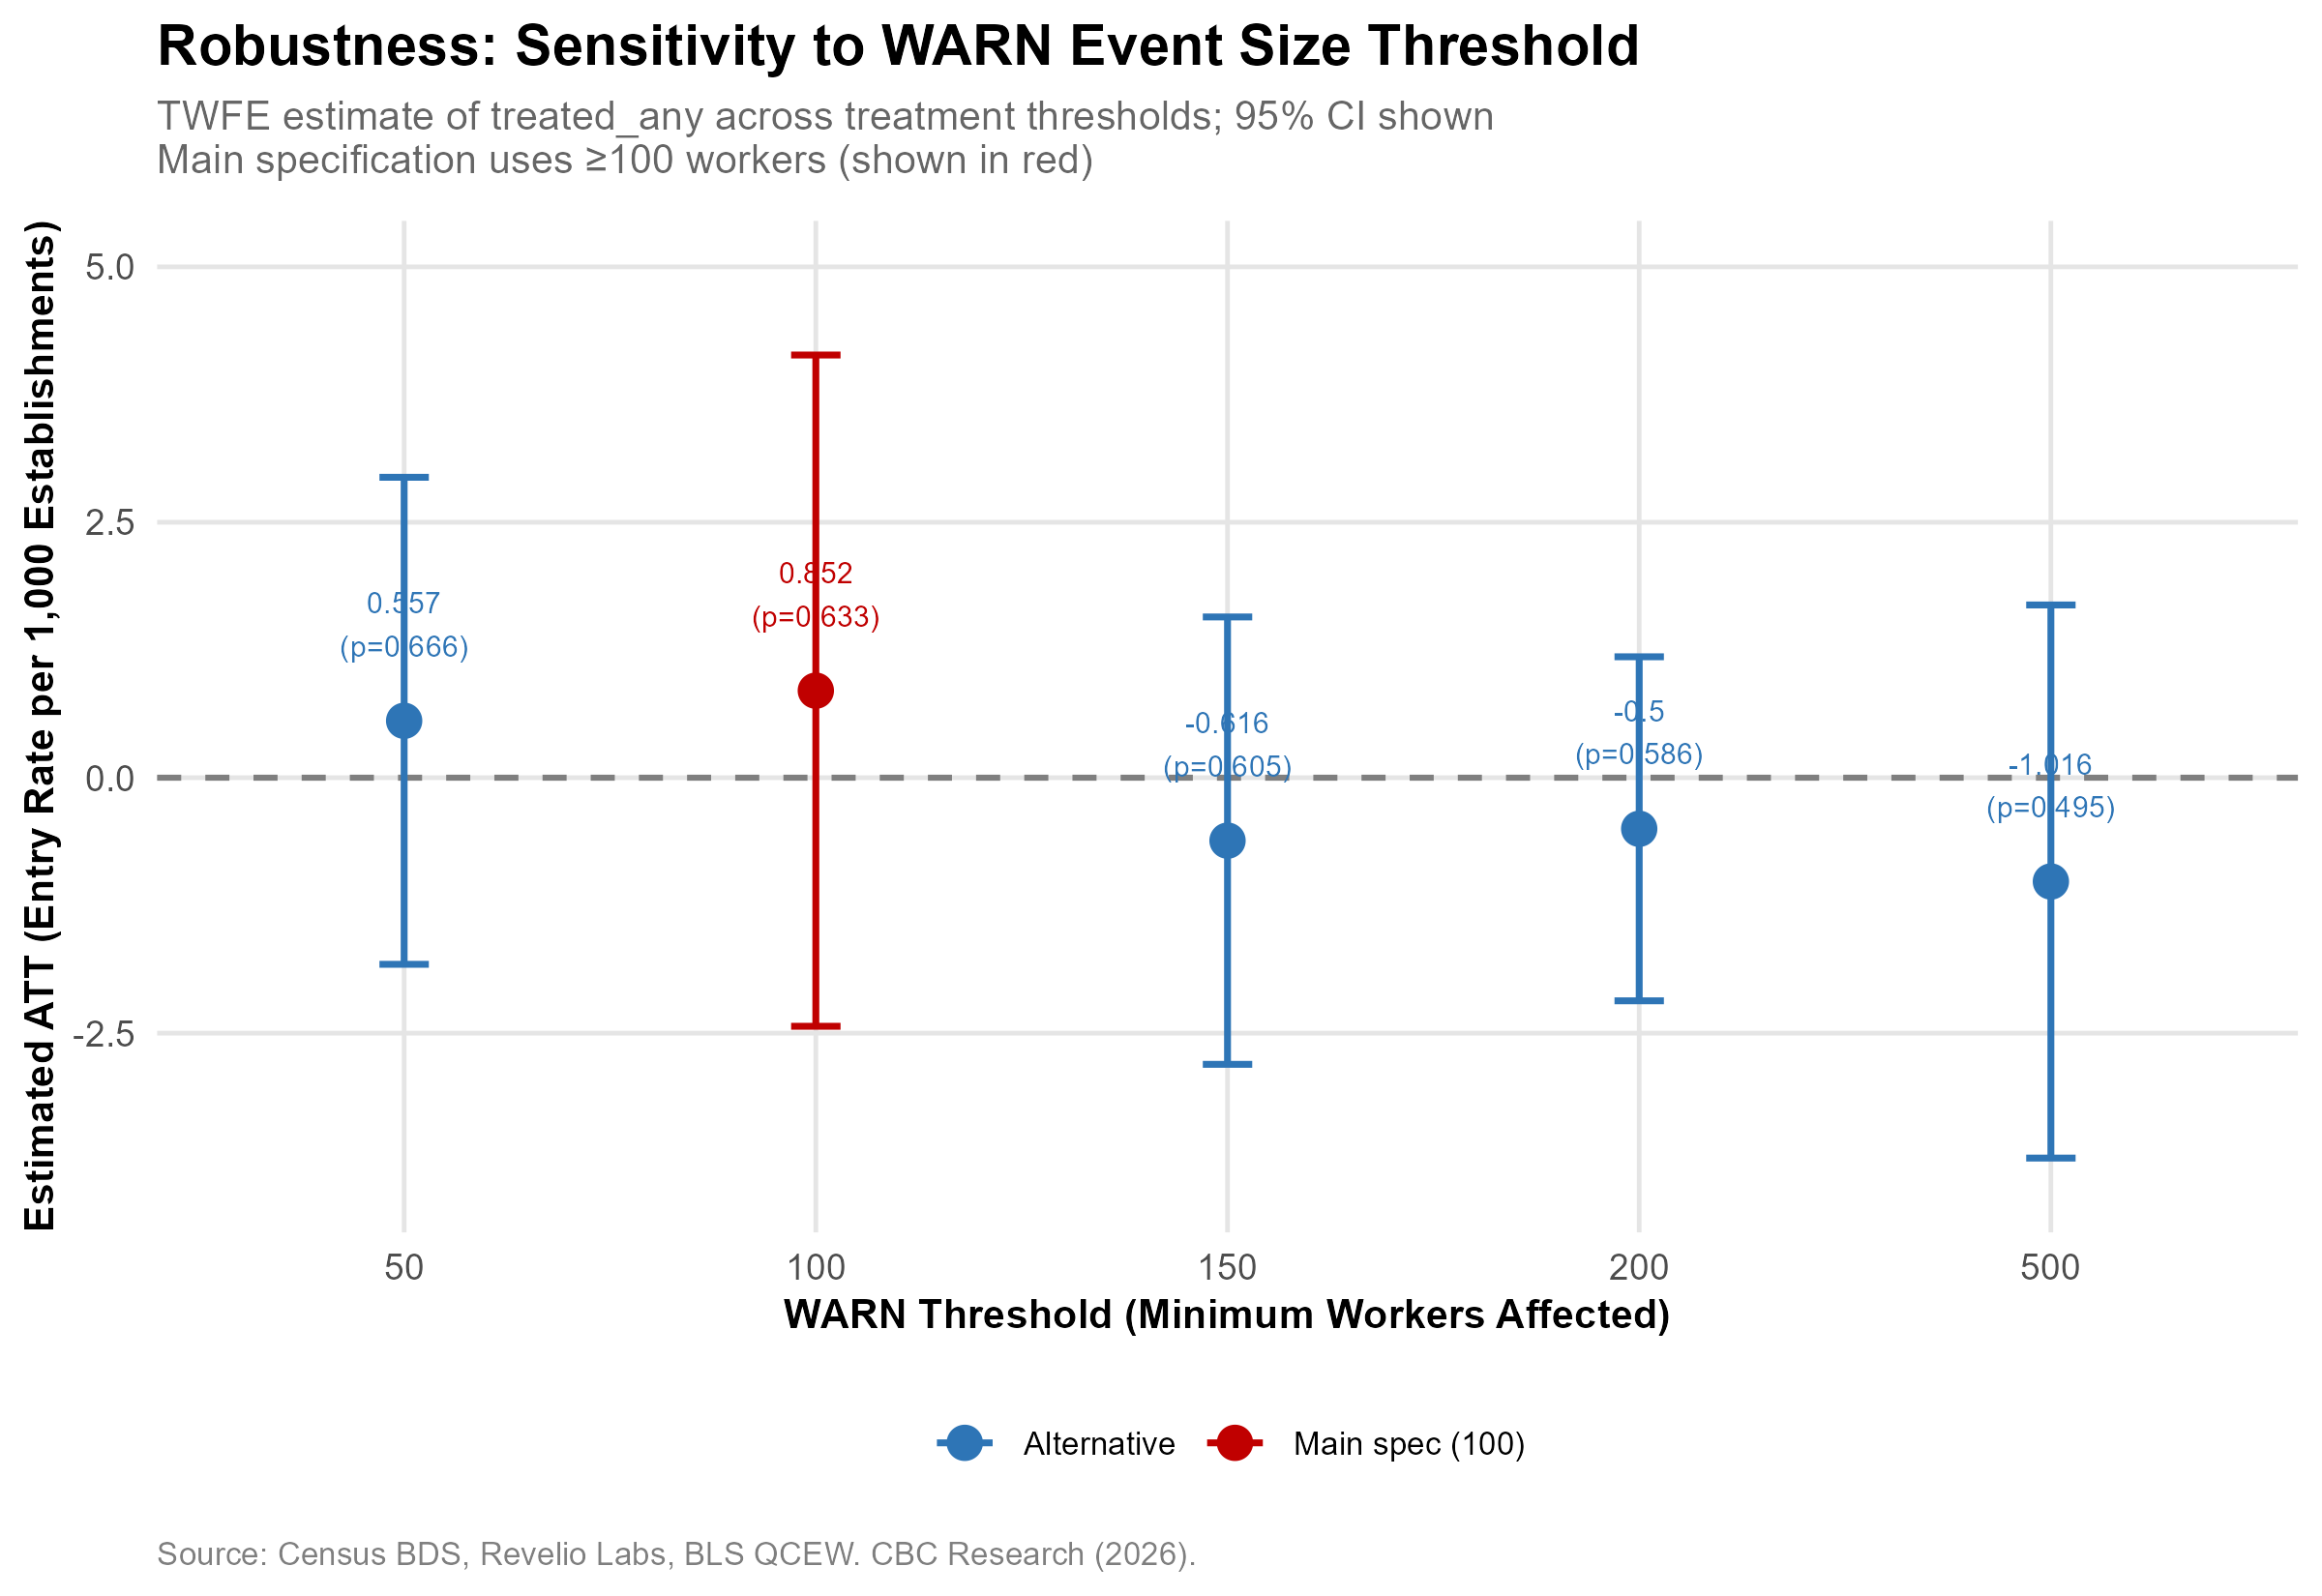
Figure 6 plots TWFE estimates across five treatment thresholds (50, 100, 150, 200, and 500 workers). Point estimates are positive at thresholds of 50 and 100 workers and negative at higher thresholds, with all estimates statistically indistinguishable from zero (all p>0.49). The sign reversal at higher thresholds reflects a compositional shift: very large layoff events (>500 workers) are concentrated in years with below-trend entry rates, while moderate events (50–100 workers) are more evenly distributed temporally. No threshold produces a significant estimate, consistent with the underlying identification constraint.
6.2 COVID Exclusion
Table 4 presents four sample variants for the primary TWFE specification: the full sample (2015–2022), excluding 2020, excluding 2020–2021, and restricting to pre-COVID (2015–2019). The estimate is positive in the full sample and the 2020-excluded sample, and negative in the two longer exclusion windows. This pattern is consistent with the post-COVID entry surge inflating entry rates in treated zone-years that happen to fall later in the panel. None of the estimates are statistically significant. These results reinforce the interpretation that the panel is too small for precise causal identification, but do not imply a true null effect.
6.3 Alternative Outcome Variables
The treatment effect on net formation rate is +0.211 (p=0.600) and on log entry count is −0.006 (p=0.750). The exit rate specification produces a negative point estimate (−1.257, p=0.641), suggesting that qualifying layoff events may slightly reduce business exit as well as increase entry — a pattern consistent with demand-side stabilization in zones where large employer contractions occur. No alternative outcome produces a statistically significant estimate.
6.4 Placebo Tests
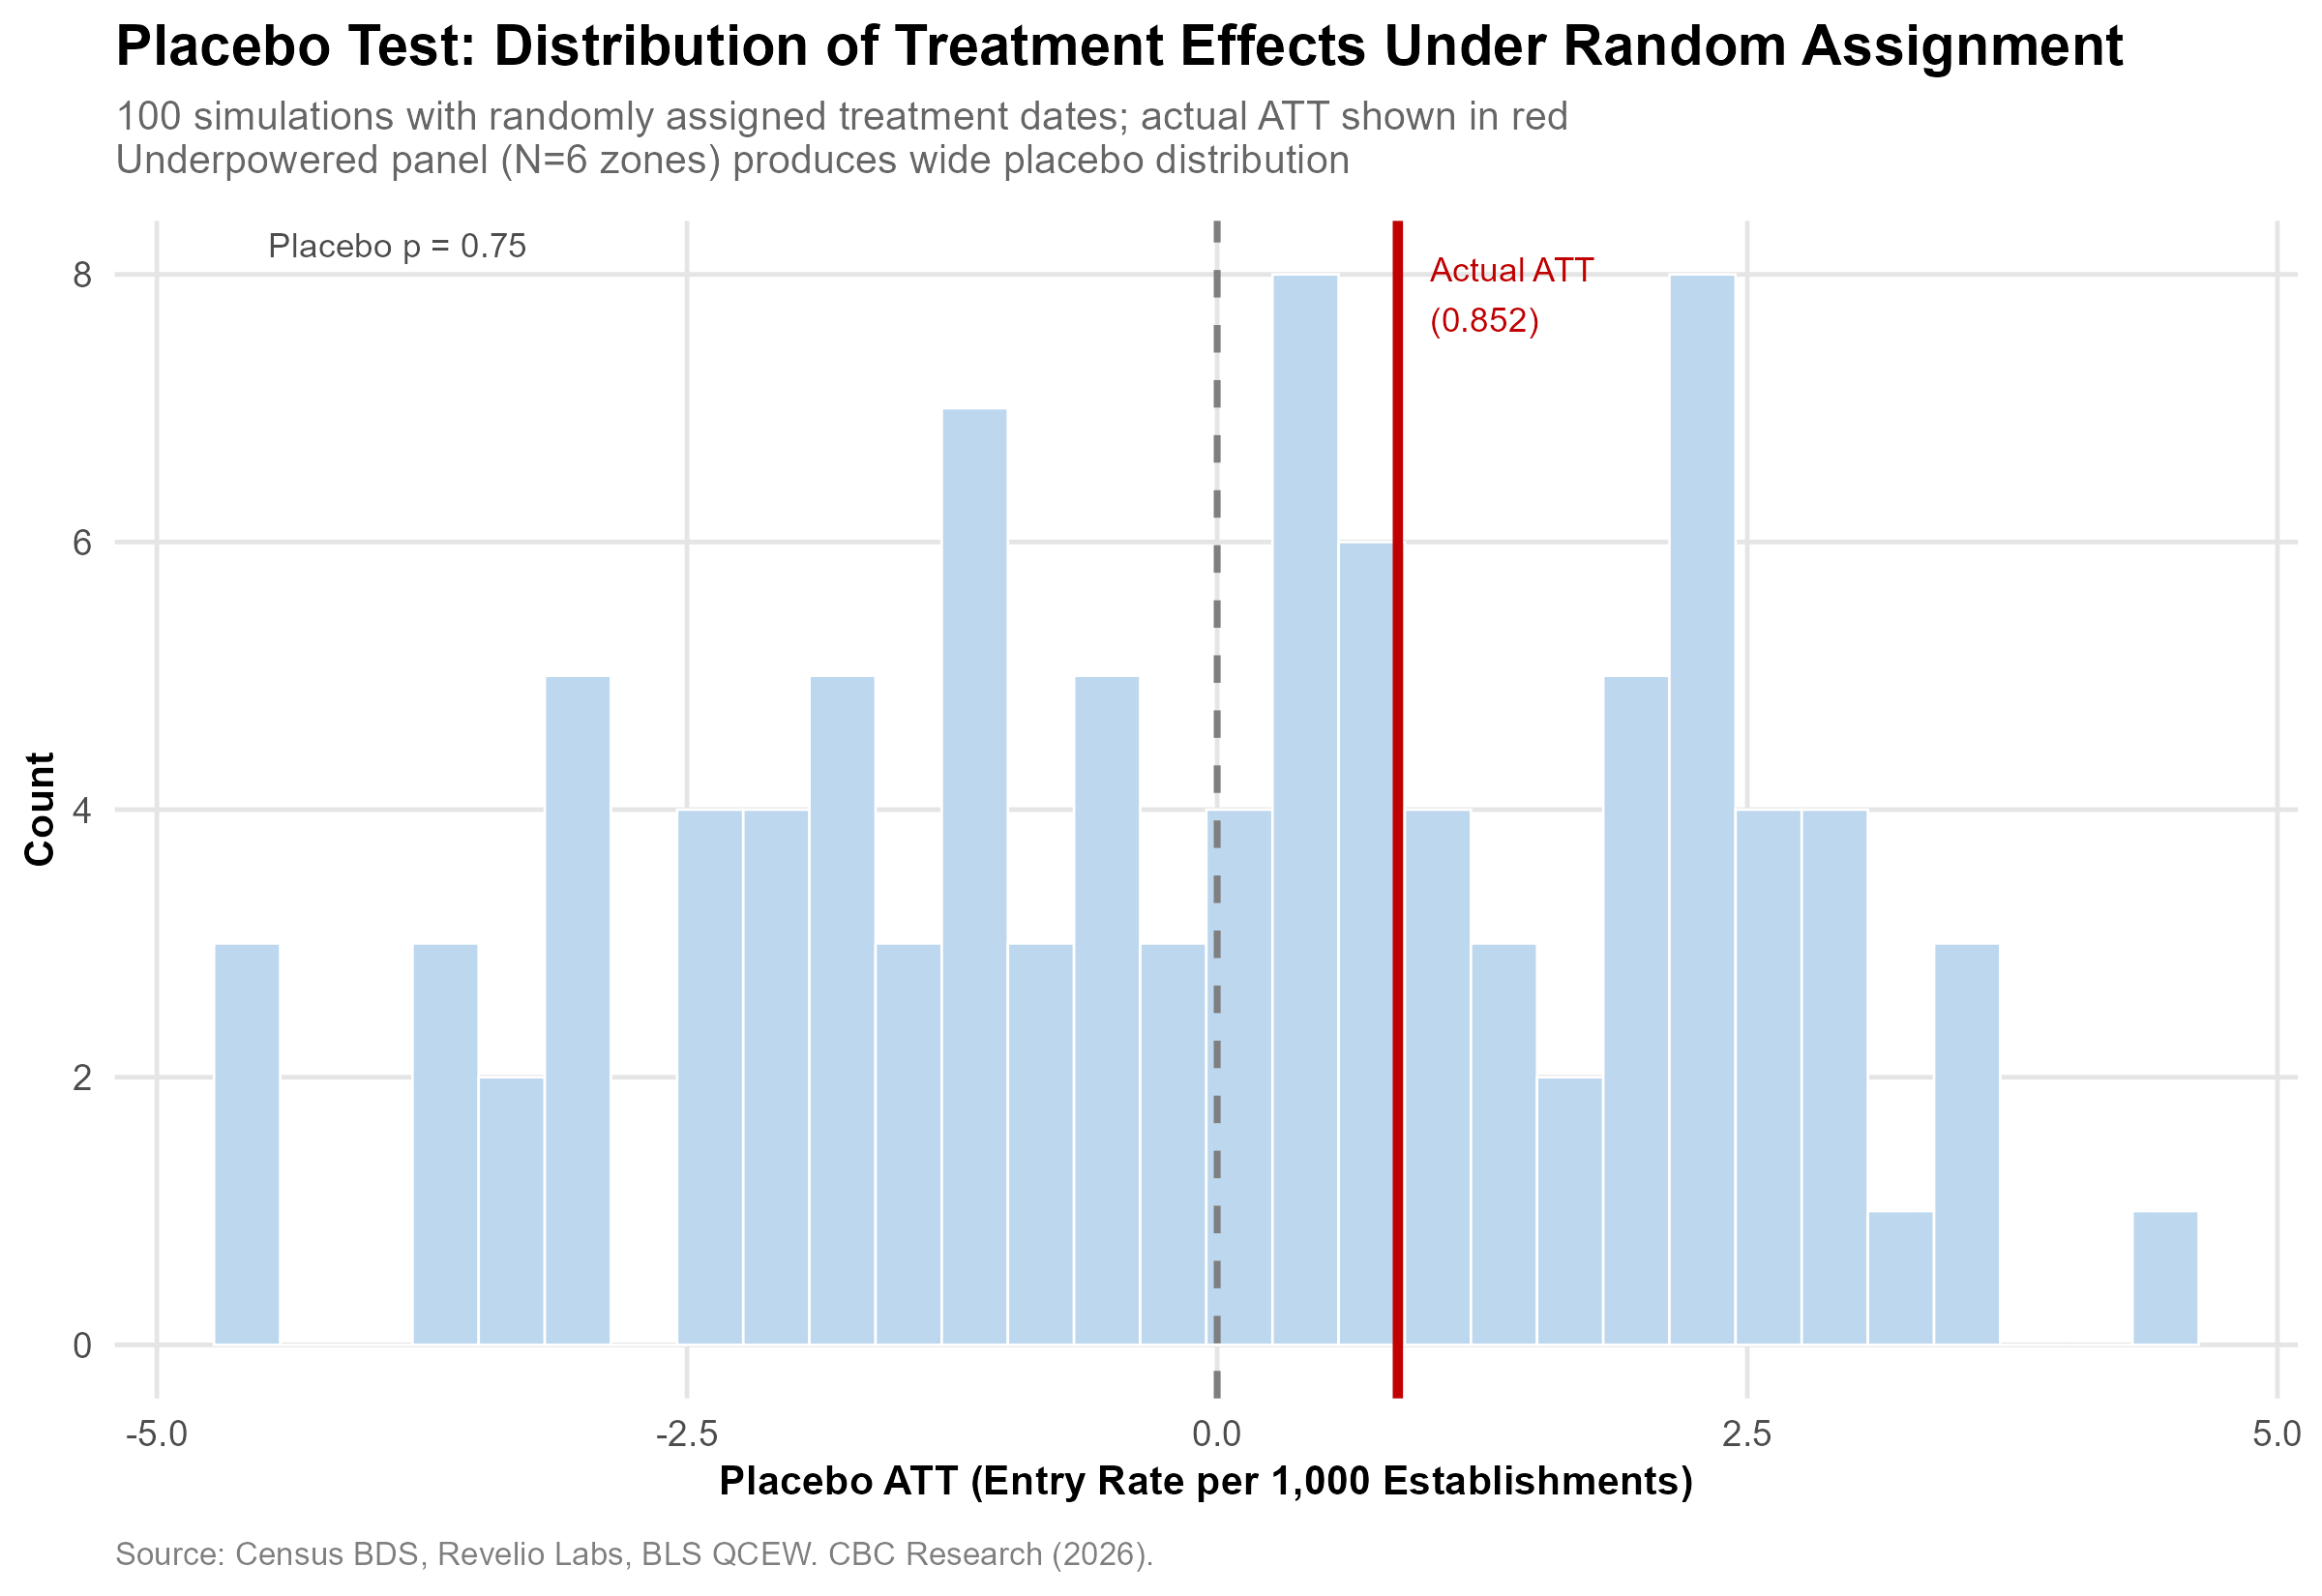
Figure 5 presents the distribution of 100 placebo ATT estimates generated by randomly assigning treatment dates to zones. The distribution is wide, reflecting the panel’s limited power, and centered near zero (placebo mean: approximately 0). The actual ATT estimate of +0.852 falls at the 75th percentile of the placebo distribution (placebo p=0.75). This result is appropriately interpreted not as evidence against a treatment effect, but as evidence that the six-zone panel cannot generate sufficient power for the placebo test to be informative. The wide placebo distribution is itself a diagnostic confirming the identification constraint.
6.5 Worcester County Sensitivity
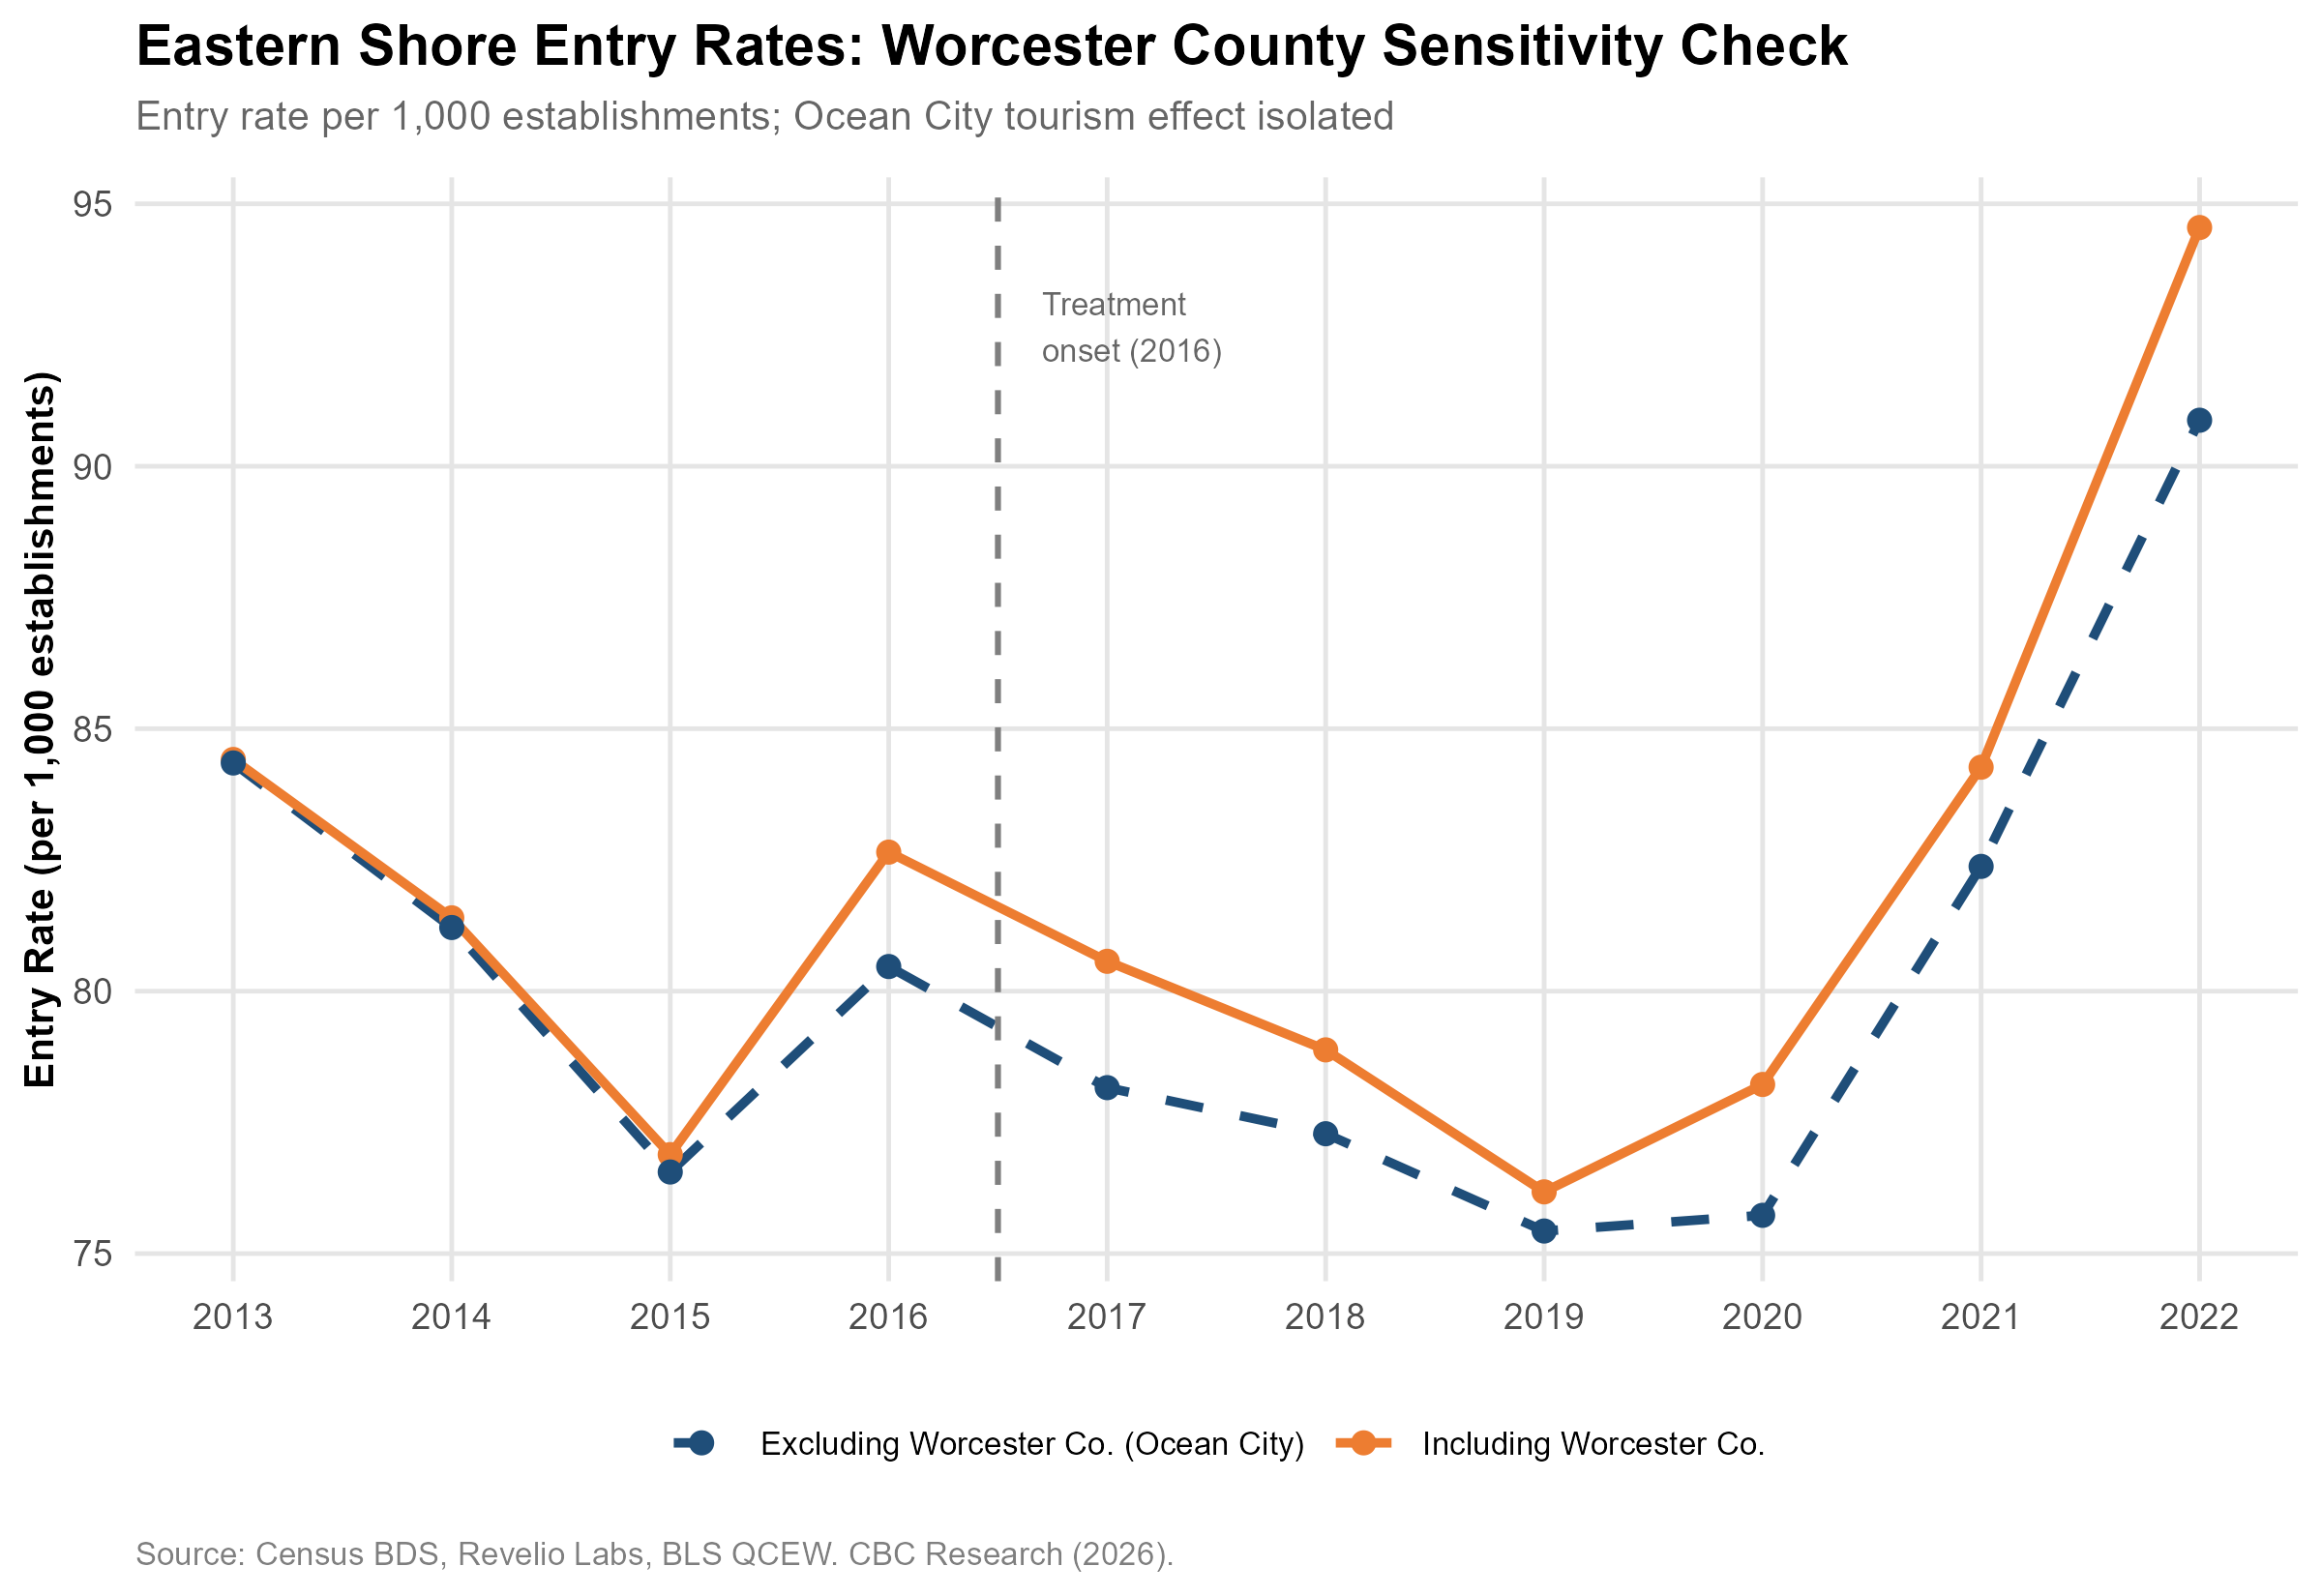
The Eastern Shore zone includes Worcester County (home to Ocean City), whose tourism-driven establishment volatility could distort zone-level entry rates. Figure 7 compares Eastern Shore entry rates computed with and without Worcester County. Including versus excluding Worcester County produces a maximum difference of 3.67 per 1,000 establishments in 2022, and both series follow near-identical trends across all years. Worcester County does not substantially influence the Eastern Shore pattern and does not affect any reported estimates.
6.6 Probit Specification Robustness
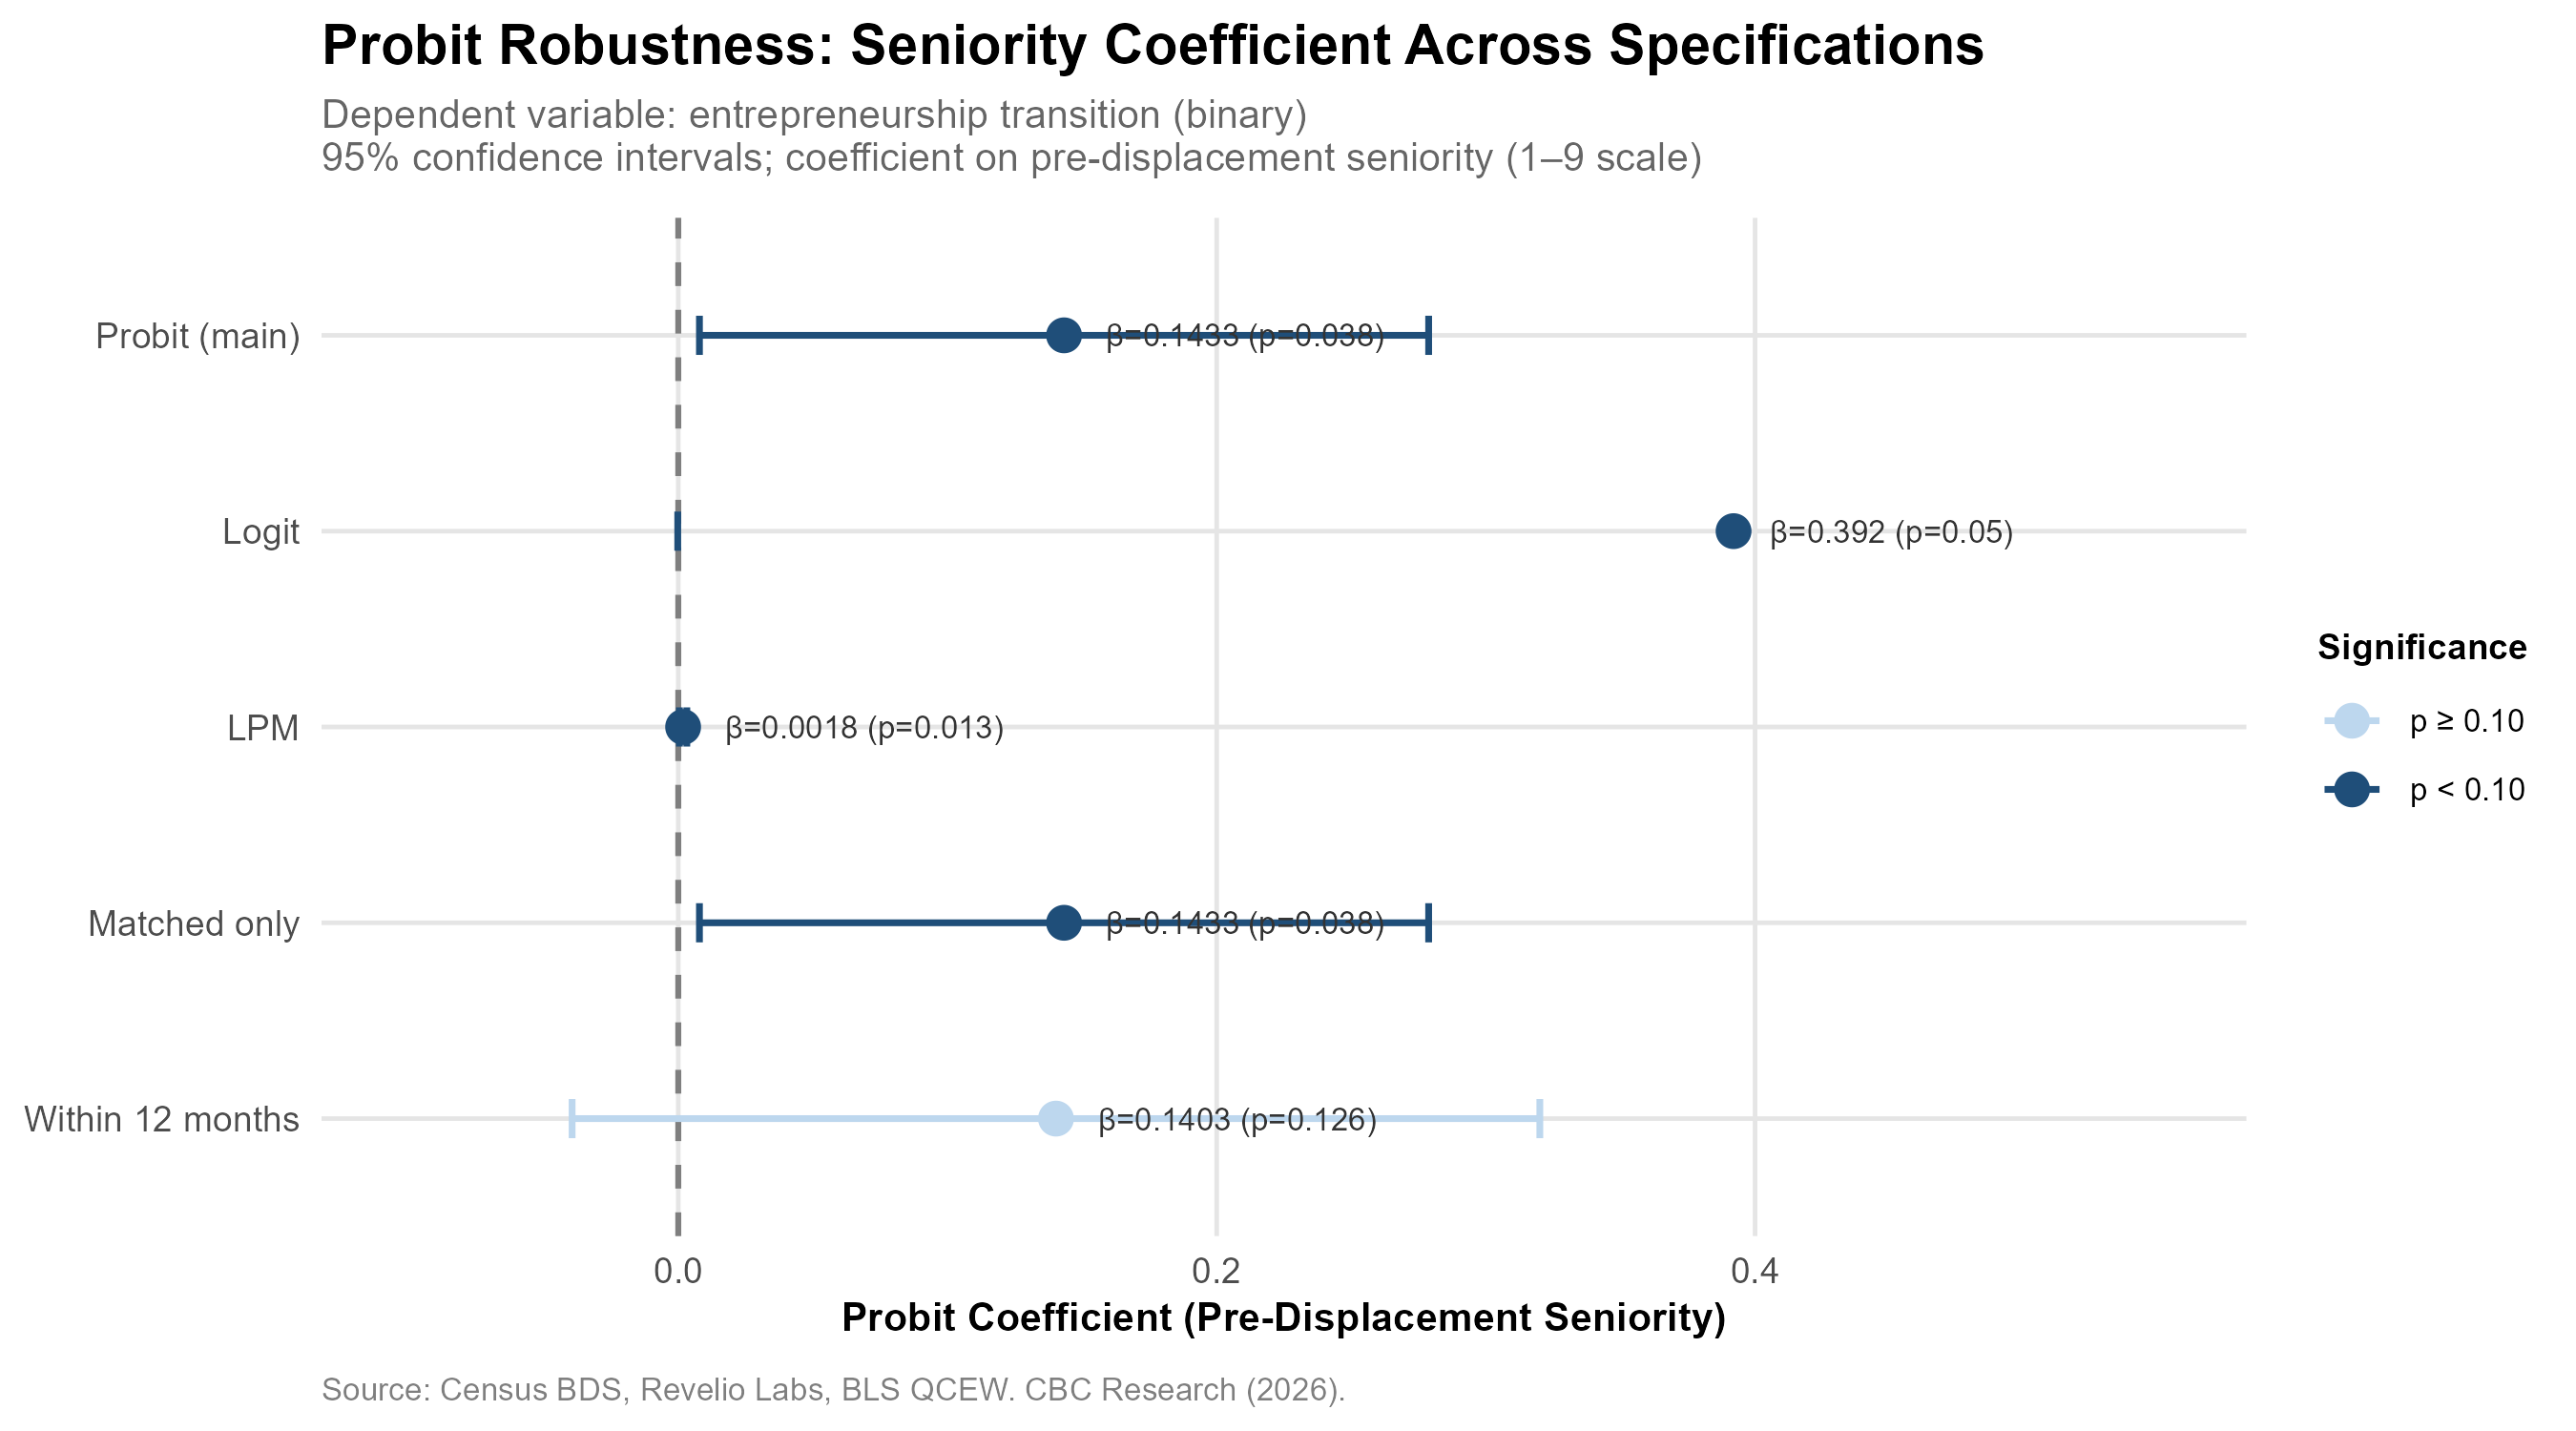
Figure 8 presents a forest plot of the seniority coefficient across five probit specifications. The coefficient is remarkably stable: β=0.143 (p=0.038) in the main probit, β=0.392 (p=0.050) in the logit, β=0.0018 (p=0.013) in the LPM, and β=0.143 (p=0.038) in the matched-worker-only sample. The 12-month window specification produces β=0.140 (p=0.126), losing significance due to smaller sample size (n=3,813) but maintaining virtually the same coefficient magnitude. The seniority finding is not an artifact of model specification.
7. Discussion
7.1 Interpretation of Core Findings
The seniority finding is consistent with the human capital theory of entrepreneurship (Lazear 2005): senior workers possess accumulated domain expertise, professional networks, and market credibility that lower the effective barriers to business formation post-displacement. The reputational and relational capital that senior workers have built over longer careers enables them to attract customers, partners, and early financing more readily than junior colleagues, reducing the risk profile of new venture formation even in the absence of greater financial reserves.
The non-result for earnings tier, once seniority is controlled, challenges financial capital constraint theory (Evans and Jovanovic 1989) as the primary mechanism within this sample. This does not necessarily imply that financial capital is irrelevant to entrepreneurship in general, but rather that among workers affected by qualifying WARN Act events in Maryland — events requiring 100 or more affected workers and therefore concentrated at medium-to-large employers — the earnings-seniority correlation is sufficiently strong that earnings does not carry independent predictive power. Future work incorporating workers from smaller employer layoffs, where the earnings distribution may be less correlated with tenure, could revisit this conclusion.
The lagged positive event-study effect (+4.97 at t+1) suggests the entrepreneurial response to displacement takes approximately 12 months to fully manifest in establishment entry data. This timeline is consistent with typical business planning, legal formation, and initial operations cycles for new ventures. Practically, it implies that workforce transition programs operating on six-month intervention windows — the standard structure of many WARN Act-triggered services — may miss the window of active entrepreneurial formation activity.
The COVID compositional finding — aggregate entry surge alongside individually lower necessity entrepreneurship among COVID displaced workers — clarifies a potentially confusing juxtaposition in the data. The post-2020 entry surge documented nationally and in Maryland reflects primarily opportunity entrepreneurship enabled by expanded savings, remote work, and digital commerce infrastructure, not necessity entrepreneurship driven by displacement. Among workers who actually experienced WARN Act displacement during COVID, the same tight labor market that generated the broader startup surge offered attractive reemployment alternatives, suppressing the displacement-to-entrepreneurship conversion rate.
7.2 Limitations
The zone-level panel (N=6) is the study’s most fundamental constraint. The near-simultaneous 2015 treatment onset across five of six zones leaves only the Eastern Shore as a clean not-yet-treated control, substantially limiting the identifying variation available to the CS DiD estimator. The confidence intervals on all aggregate estimates are correspondingly wide, and the placebo test confirms that the panel cannot distinguish a moderately-sized true effect from sampling noise. The analysis should be understood as providing directional evidence and a methodological template for future county-level replication, not as a definitive causal estimate.
The Revelio entrepreneurship capture rate of 0.31% almost certainly understates true entrepreneurial activity. Workers who launch informal businesses, operate as sole proprietors under their personal name, or maintain a primary employer while operating a nascent venture on the side are unlikely to appear as entrepreneurial role transitions in Revelio’s employment records. The Sub-Study B estimates should therefore be interpreted as lower bounds on the actual displacement-to-entrepreneurship conversion rate.
Sector classification is additionally limited by 44.5% of workers classified as Other/Unknown, reflecting gaps in Revelio’s role taxonomy coverage. The sector heterogeneity results should be interpreted cautiously, as the classified 55.5% of workers may not be representative of the full displaced worker population.
7.3 Policy Implications
These findings carry three primary policy implications for Maryland economic development practitioners. First, workforce development programs targeting displaced workers should explicitly prioritize senior-level workers (seniority levels 5+ on Revelio’s scale, corresponding broadly to senior individual contributors, managers, and directors) as the demographic most likely to convert displacement into business formation. This population needs business formation support — legal structuring, access to SBA financing, mentorship from established entrepreneurs, and market entry guidance — rather than the job retraining and re-employment support programs designed for junior workers returning to traditional employment.
Second, the Maryland Department of Commerce and the Maryland Economic Development Corporation should implement systematic monitoring of WARN Act filings as an early-intervention trigger for entrepreneurship support outreach. Given the documented 12-month lag between displacement and measurable business formation, outreach initiated at the time of WARN filing — rather than after reemployment outcomes are observed — would target workers during the business planning phase when intervention is most actionable. Connecting senior workers with Maryland’s Small Business Development Center (SBDC) network immediately following WARN notification could meaningfully increase conversion rates.
Third, the federal contractor pipeline finding deserves particular attention from state and federal policymakers. Major Maryland defense contractors including Booz Allen Hamilton, Lockheed Martin, Northrop Grumman, and DynCorp International — all of which appear in the top qualifying layoff events in our data — represent a concentrated pipeline of high-seniority, high-human-capital Knowledge/Tech workers. Drawdowns at these employers may catalyze significant downstream business formation activity in cybersecurity, defense technology, government consulting, and adjacent sectors. Programs specifically designed to channel defense contractor talent into civilian small business formation could leverage this pipeline effectively.
8. Conclusion
This paper provides the first matched analysis of WARN Act layoff events and entrepreneurial career transitions in Maryland using individual-level labor market data. The primary contribution is the identification of pre-displacement seniority — rather than earnings tier — as the key predictor of post-displacement entrepreneurship, a finding that is robust to model specification, estimation method, and sample restriction. Human capital accumulated over careers, not financial capital accumulated through wages, is the binding constraint on displacement-driven entrepreneurship within the wage ranges and employer types represented in this sample.
The aggregate zone-level entry rate evidence is directionally supportive of a layoff-to-entrepreneur pipeline, with a CS DiD overall ATT of +2.271 and a marginally significant event-study estimate of +4.97 at one year post-treatment. The statistical imprecision of these estimates reflects the identification challenge posed by a six-zone panel with near-simultaneous treatment onset rather than the absence of a true effect.
Future work should extend the analysis to the county level (N=24), which would provide nearly four times the cross-sectional variation and dramatically improve CS DiD precision. Incorporating Maryland SDAT business formation and dissolution records since 1990 would enable survival analysis of displacement-originated businesses, testing whether seniority predicts not only formation but also venture longevity. Patent data from WRDS could further test whether layoff-displaced workers from knowledge-intensive firms generate measurable downstream innovation, extending the analysis from business formation to economic productivity.
These results underscore the dual character of economic displacement: a shock that destroys wage income and organizational attachment while simultaneously releasing human capital into the entrepreneurial ecosystem. Which effect dominates — and for whom — depends critically on the characteristics of the displaced worker, not merely the magnitude of the layoff event.
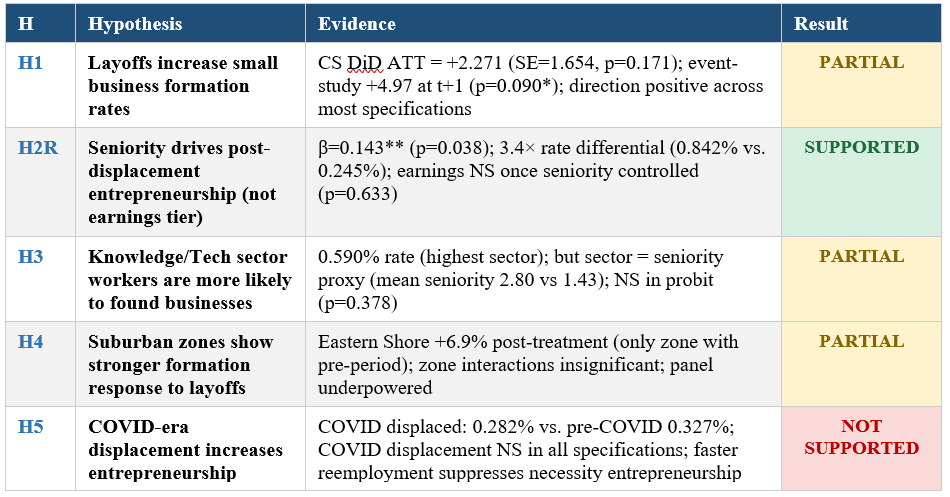
Appendix: Hypothesis Scorecard
References
Audretsch, D.B. (1995). Innovation and Industry Evolution. Cambridge, MA: MIT Press.
Baker, A., Larcker, D., & Wang, C. (2022). How Much Should We Trust Staggered Difference-in-Differences Estimates? Journal of Financial Economics, 144(2), 370–395.
Bergé, L. (2018). Efficient Estimation of Maximum Likelihood Models with Multiple Fixed-Effects: The R Package FENmlm. CREA Discussion Paper, 13.
Callaway, B. & Sant’Anna, P.H.C. (2021). Difference-in-Differences with Multiple Time Periods. Journal of Econometrics, 225(2), 200–230.
DeBaugh, M. (2024). Stadium Effects and the Small Business Ecosystem: Evidence from the Baltimore Ravens and Orioles, 2002–2022. Working Paper, CBC Research.
Decker, R., Haltiwanger, J., Jarmin, R., & Miranda, J. (2014). The Role of Entrepreneurship in US Job Creation and Economic Dynamism. Journal of Economic Perspectives, 28(3), 3–24.
Delgado, M., Porter, M.E., & Stern, S. (2010). Clusters and Entrepreneurship. Journal of Economic Geography, 10(4), 495–518.
Evans, D.S. & Jovanovic, B. (1989). An Estimated Model of Entrepreneurial Choice under Liquidity Constraints. Journal of Political Economy, 97(4), 808–827.
Glaeser, E.L., Kerr, S.P., & Kerr, W.R. (2010). Entrepreneurship and Urban Growth: An Empirical Assessment with Historical Mines. Review of Economics and Statistics, 97(2), 498–520.
Haltiwanger, J., Jarmin, R.S., & Miranda, J. (2013). Who Creates Jobs? Small versus Large versus Young. Review of Economics and Statistics, 95(2), 347–361.
Jacobson, L., LaLonde, R., & Sullivan, D. (1993). Earnings Losses of Displaced Workers. American Economic Review, 83(4), 685–709.
Kerr, W.R. & Nanda, R. (2009). Democratizing Entry: Banking Deregulations, Financing Constraints, and Entrepreneurship. Journal of Financial Economics, 94(1), 124–149.
Lachowska, M., Mas, A., & Woodbury, S.A. (2020). Sources of Displaced Workers’ Long-Term Earnings Losses. American Economic Review, 110(10), 3231–3266.
Lazear, E.P. (2005). Entrepreneurship. Journal of Labor Economics, 23(4), 649–680.
Moretti, E. (2010). Local Multipliers. American Economic Review, 100(2), 373–377.
Shane, S. (2003). A General Theory of Entrepreneurship: The Individual-Opportunity Nexus. Cheltenham, UK: Edward Elgar.
Source: Census BDS, Revelio Labs, BLS QCEW. CBC Research (2026).